

Question: Please find the problem on control charts Do Control Chart Problem #1 below: (For all control chart problems, show graphs and work) The management of

Please find the problem on control charts
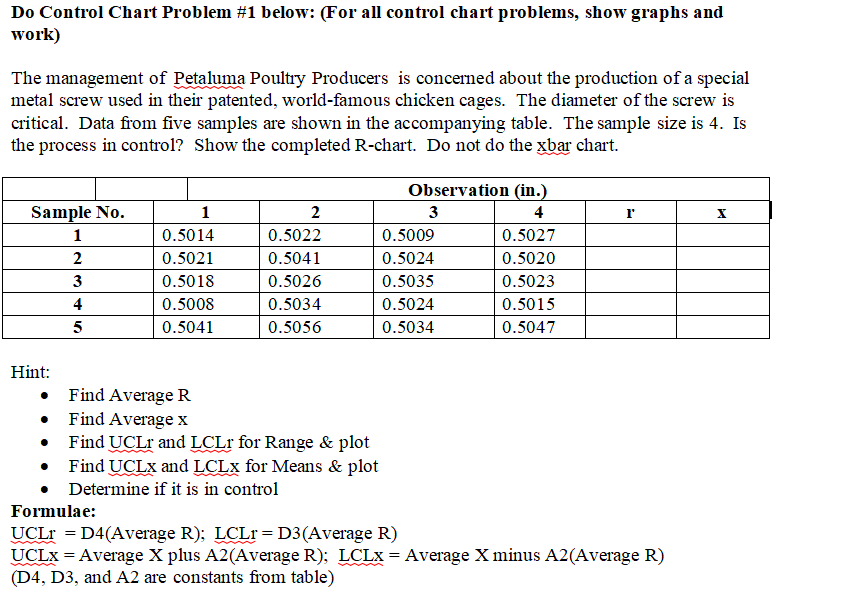
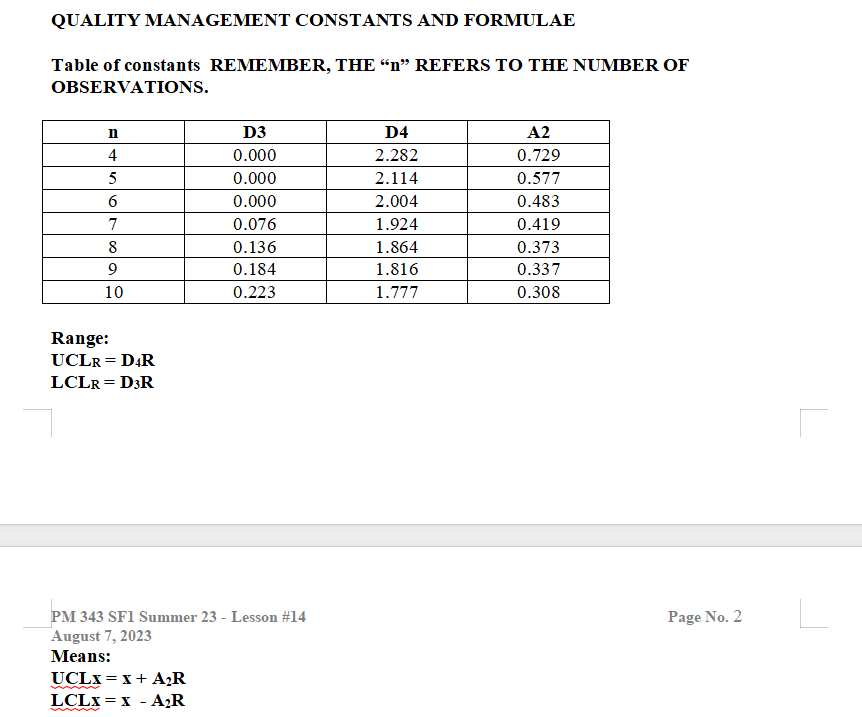
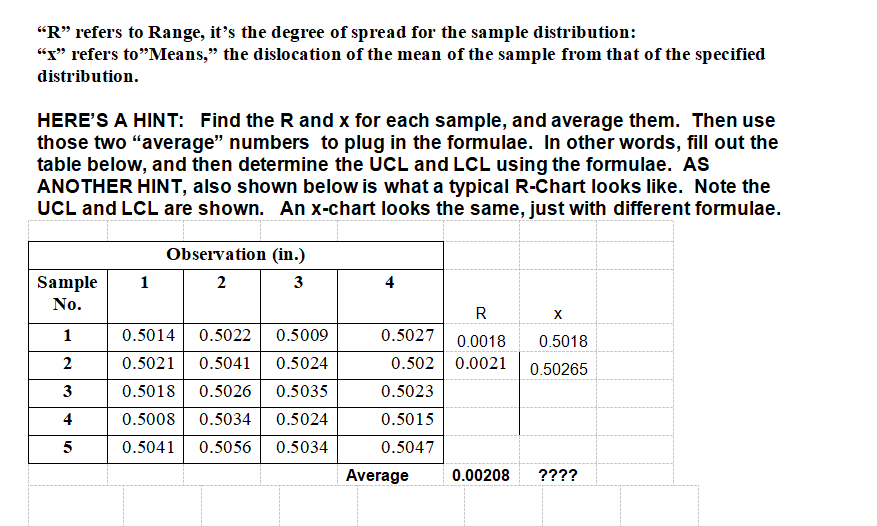

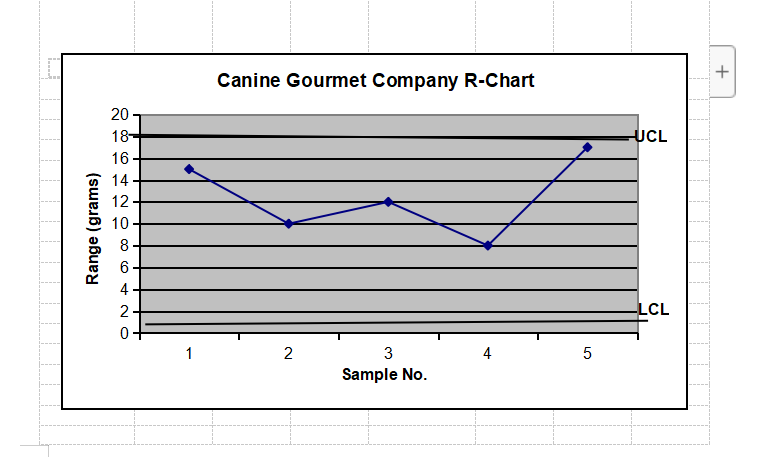
Do Control Chart Problem #1 below: (For all control chart problems, show graphs and work) The management of Petaluma Poultry Producers is concerned about the production of a special metal screw used in their patented, world-famous chicken cages. The diameter of the screw is critical. Data from five samples are shown in the accompanying table. The sample size is 4. Is the process in control? Show the completed R-chart. Do not do the xbar chart. Observation (in.) Sample No. 1 2 3 4 X 1 0.5014 0.5022 0.5009 0.5027 2 0.5021 0.5041 0.5024 0.5020 0.5018 0.5026 0.5035 0.5023 0.5008 0.5034 0.5024 0.5015 0.5041 0.5056 0.5034 0.5047 Hint: Find Average R . Find Average x Find UCLr and LCLr for Range & plot Find UCLx and LCLx for Means & plot . Determine if it is in control Formulae: UCLr = D4(Average R); LCLr = D3(Average R) UCLX = Average X plus A2(Average R); LCLX = Average X minus A2(Average R) (D4, D3, and A2 are constants from table)QUALITY MANAGEMENT CONSTANTS AND FORMULAE Table of constants REMEMBER, THE "n" REFERS TO THE NUMBER OF OBSERVATIONS. n D3 D4 A2 4 0.000 2.282 0.729 0.000 2.114 0.577 6 0.000 2.004 0.483 0.076 1.924 0.419 0.136 1.864 0.373 0.184 1.816 0.337 10 0.223 1.777 0.308 Range: UCLR = DAR LCLR = D3R PM 343 SF1 Summer 23 - Lesson #14 Page No. 2 August 7, 2023 Means: UCLX = X + AR LCLX = X - AR"R" refers to Range, it's the degree of spread for the sample distribution: "x" refers to"Means," the dislocation of the mean of the sample from that of the specified distribution. HERE'S A HINT: Find the R and x for each sample, and average them. Then use those two "average" numbers to plug in the formulae. In other words, fill out the table below, and then determine the UCL and LCL using the formulae. AS ANOTHER HINT, also shown below is what a typical R-Chart looks like. Note the UCL and LCL are shown. An x-chart looks the same, just with different formulae. Observation (in.) Sample 1 2 3 No. R X 0.5014 0.5022 0.5009 0.5027 0.0018 0.5018 0.5021 0.5041 0.5024 0.502 0.0021 0.50265 0.5018 0.5026 0.5035 0.5023 4 0.5008 0.5034 0.5024 0.5015 5 0.5041 0.5056 0.5034 0.5047 Average 0.00208 ????Canine Gourmet Company R-Chart + 20 18 UCL 16 - Range (grams) ONDODONE LCL 2 3 4 5 Sample No
Step by Step Solution
There are 3 Steps involved in it

Get step-by-step solutions from verified subject matter experts