

Question: Please find the test statistic, the p value, and the upper and lower bound of the data. Thank You so Much!!!! 11.2.7-T # Question Help
Please find the test statistic, the p value, and the upper and lower bound of the data. Thank You so Much!!!!
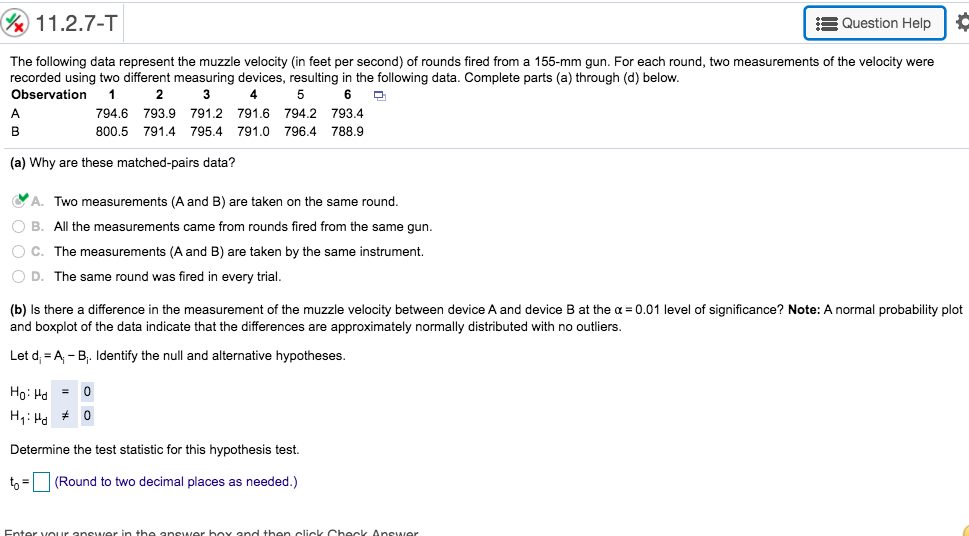
11.2.7-T # Question Help The following data represent the muzzle velocity (in feet per second) of rounds fired from a 155-mm gun. For each round, two measurements of the velocity were recorded using two different measuring devices, resulting in the following data. Complete parts (a) through (d) below. Observation 1 2 3 5 6 A 794.6 793.9 791.2 791.6 794.2 793.4 800.5 791.4 795.4 791.0 796.4 788.9 (a) Why are these matched-pairs data? CA. Two measurements (A and B) are taken on the same round. O B. All the measurements came from rounds fired from the same gun. O C. The measurements (A and B) are taken by the same instrument. O D. The same round was fired in every trial. (b) Is there a difference in the measurement of the muzzle velocity between device A and device B at the a = 0.01 level of significance? Note: A normal probability plot and boxplot of the data indicate that the differences are approximately normally distributed with no outliers. Let di = A; - B;. Identify the null and alternative hypotheses. Ho: Hd Hy: Hd 10 Determine the test statistic for this hypothesis test. to =(Round to two decimal places as needed.)
Step by Step Solution
There are 3 Steps involved in it

Get step-by-step solutions from verified subject matter experts