Question: PLEASE FIX THE RED Problem 11-6 (Static) Manager Chris Channing of Fabric Mills, Inc., has developed the forecast shown in the table for bolts of
PLEASE FIX THE RED
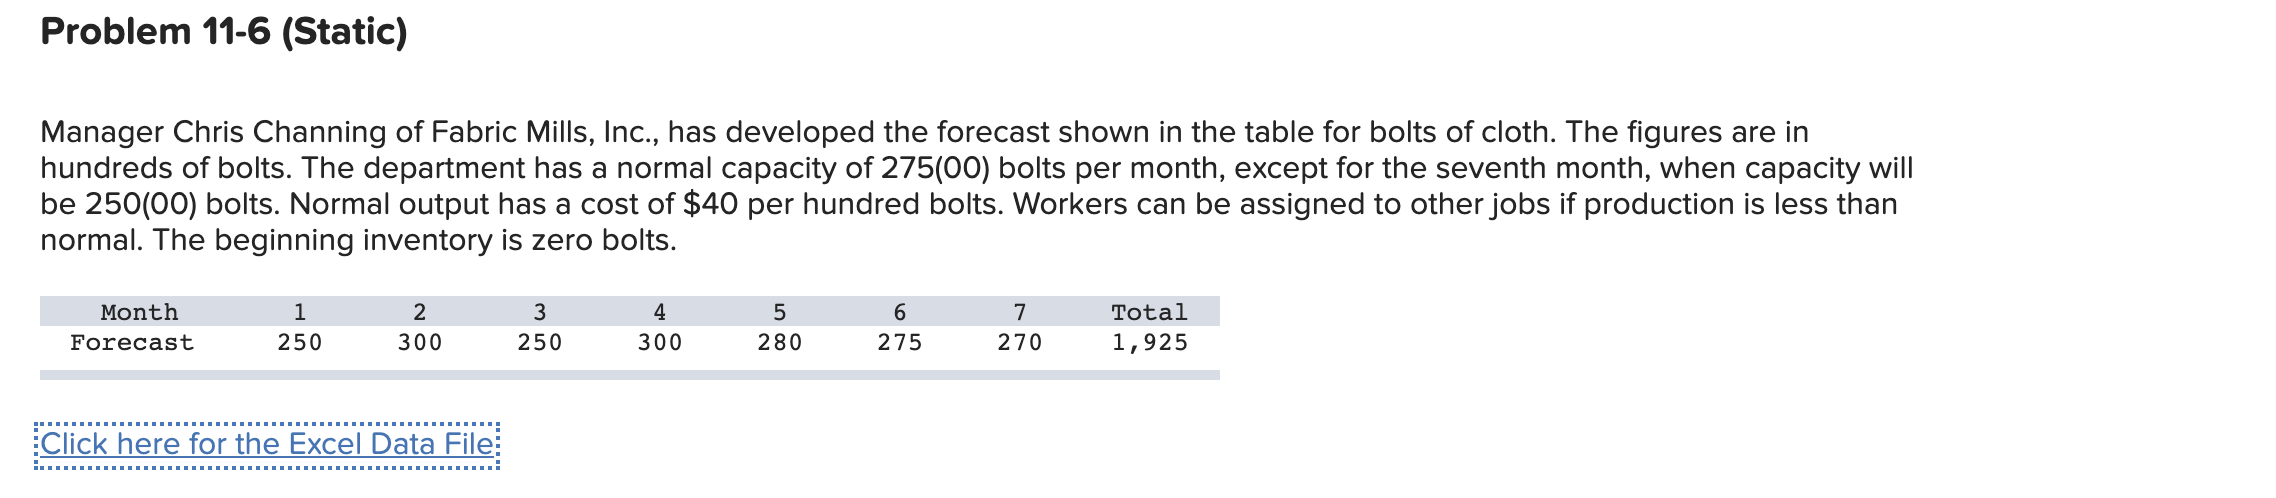
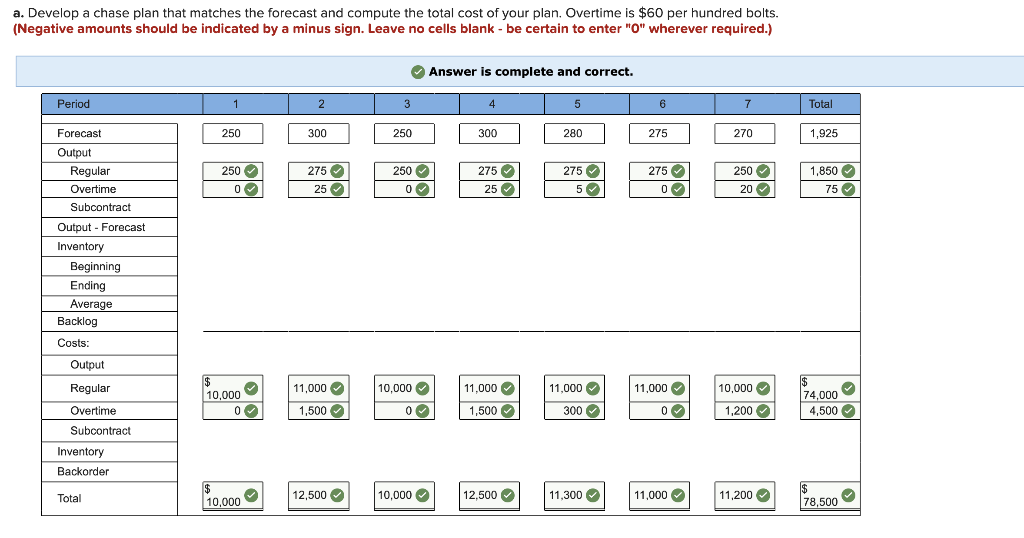
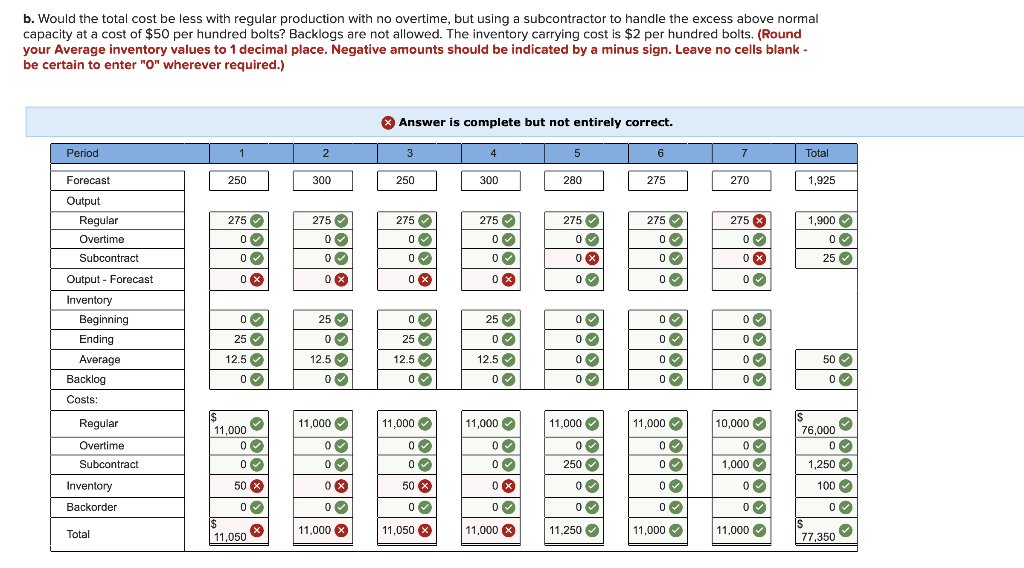
Problem 11-6 (Static) Manager Chris Channing of Fabric Mills, Inc., has developed the forecast shown in the table for bolts of cloth. The figures are in hundreds of bolts. The department has a normal capacity of 275(00) bolts per month, except for the seventh month, when capacity will be 250(00) bolts. Normal output has a cost of $40 per hundred bolts. Workers can be assigned to other jobs if production is less than normal. The beginning inventory is zero bolts. Month Forecast 1 250 2 300 3 250 4 300 5 280 6 275 7 270 Total 1,925 Click here for the Excel Data File: a. Develop a chase plan that matches the forecast and compute the total cost of your plan. Overtime is $60 per hundred bolts. (Negative amounts should be indicated by a minus sign. Leave no cells blank - be certain to enter "O" wherever required.) Answer is complete and correct. Period 1 2 3 4 5 6 7 Total Forecast 250 300 250 300 280 275 270 1,925 275 1,850 250 0 0 250 0 0 275 25 275 5 275 0 0 250 20 25 75 Output Regular Overtime Subcontract Output - Forecast Inventory Beginning Ending Average Backlog Costs: Output Regular 11,000 10,000 11,000 11.000 $ 10,000 0 11,000 0 10,000 1,200 $ 74,000 4,500 1,500 0 1,500 300 Overtime Subcontract Inventory Backorder Total $ 10,000 12,500 10,000 12,500 11,300 11,000 11,200 $ 78,500 b. Would the total cost be less with regular production with no overtime, but using a subcontractor to handle the excess above normal capacity at a cost of $50 per hundred bolts? Backlogs are not allowed. The inventory carrying cost is $2 per hundred bolts. (Round your Average inventory values to 1 decimal place. Negative amounts should be indicated by a minus sign. Leave no cells blank - be certain to enter "O" wherever required.) Answer is complete but not entirely correct. Period 1 2 3 4 5 6 7 Total Forecast 250 300 250 300 280 275 270 270 1,925 275 275 275 1,900 Output Regular Overtime Subcontract 0 275 0 0 0 275 0 0 0 275 0 0 X 0 0 275 X 0 0 x 0 0 0 0 0 25 0 X 0 % 0 X 0 X 0 0 0 0 0 25 0 0 25 Output - Forecast Inventory Beginning Ending Average Backlog Costs: 0 0 25 0 25 0 0 0 0 0 0 0 0 0 0 0 0 0 0 12.5 12.5 12.5 0 0 50 12.5 0 0 0 0 0 0 0 0 11,000 11,000 10,000 11,000 0 0 0 11,000 0 0 0 Regular Overtime Subcontract Inventory 0 11,000 0 0 0 Soolol 0 0 11,000 0 0 0 0 X 0 0 OOOOOO 250 OOOOOOOO | OOOOOO OOOOOO 1,000 0 0 50 X 50 % 0 0 76,000 0 0 1,250 100 0 0 S 77,350 0 1 Backorder 0 0 0 0 0 0 0 $ 11,050 Total 11,000 X 11,050 11.000 X 11.250 11,000 11,000


