

Question: Please follow instructions as I have done it incorrectly 3 times 8:41 ocks A. Executive Information System Reporting for Decision Support The City of Highlands
Please follow instructions as I have done it incorrectly 3 times
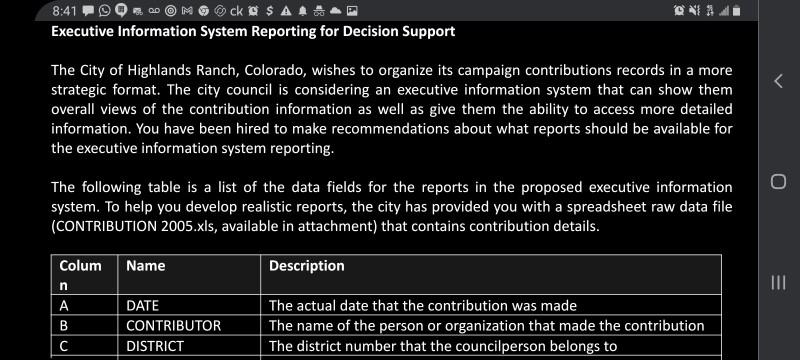
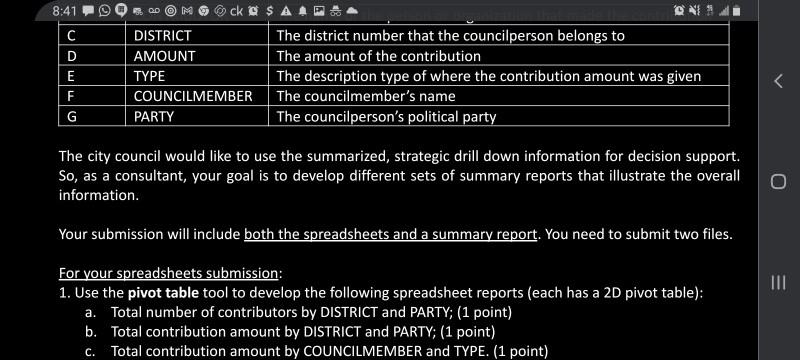
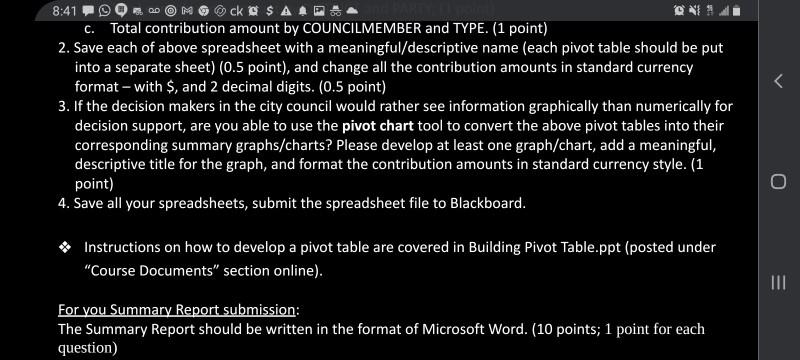
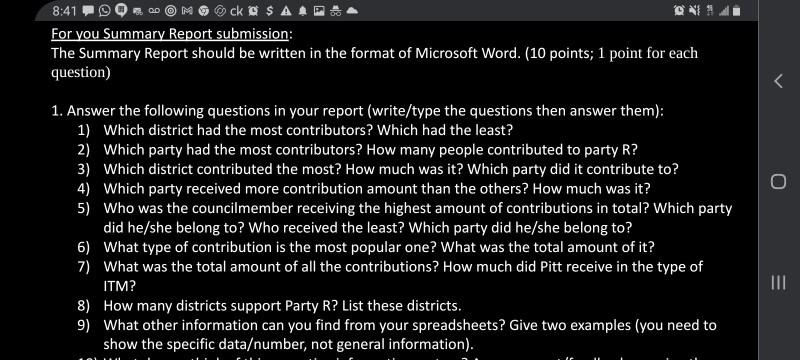
8:41 ocks A. Executive Information System Reporting for Decision Support The City of Highlands Ranch, Colorado, wishes to organize its campaign contributions records in a more strategic format. The city council is considering an executive information system that can show them overall views of the contribution information as well as give them the ability to access more detailed information. You have been hired to make recommendations about what reports should be available for the executive information system reporting. The following table is a list of the data fields for the reports in the proposed executive information system. To help you develop realistic reports, the city has provided you with a spreadsheet raw data file (CONTRIBUTION 2005.xls, available in attachment) that contains contribution details. Name Description III Colum n A B DATE CONTRIBUTOR DISTRICT The actual date that the contribution was made The name of the person or organization that made the contribution The district number that the councilperson belongs to 8:41 C D E F ck $ AL ONS DISTRICT The district number that the councilperson belongs to AMOUNT The amount of the contribution TYPE The description type of where the contribution amount was given COUNCILMEMBER The councilmember's name PARTY The councilperson's political party The city council would like to use the summarized, strategic drill down information for decision support. So, as a consultant, your goal is to develop different sets of summary reports that illustrate the overall information. o Your submission will include both the spreadsheets and a summary report. You need to submit two files. 111 For your spreadsheets submission: 1. Use the pivot table tool to develop the following spreadsheet reports (each has a 2D pivot table): a. Total number of contributors by DISTRICT and PARTY; (1 point) b. Total contribution amount by DISTRICT and PARTY; (1 point) C. Total contribution amount by COUNCILMEMBER and TYPE. (1 point) 8:41 ck SA C. Total contribution amount by COUNCILMEMBER and TYPE. (1 point) 2. Save each of above spreadsheet with a meaningful/descriptive name (each pivot table should be put into a separate sheet) (0.5 point), and change all the contribution amounts in standard currency format with $, and 2 decimal digits. (0.5 point) 3. If the decision makers in the city council would rather see information graphically than numerically for decision support, are you able to use the pivot chart tool to convert the above pivot tables into their corresponding summary graphs/charts? Please develop at least one graph/chart, add a meaningful, descriptive title for the graph, and format the contribution amounts in standard currency style. (1 point) 4. Save all your spreadsheets, submit the spreadsheet file to Blackboard. Instructions on how to develop a pivot table are covered in Building Pivot Table.ppt (posted under "Course Documents section online). 111 For you Summary Report submission: The Summary Report should be written in the format of Microsoft Word. (10 points; 1 point for each question) 8:41 ck O SA. For you Summary Report submission: The Summary Report should be written in the format of Microsoft Word. (10 points; 1 point for each question) 1. Answer the following questions in your report (write/type the questions then answer them): 1) Which district had the most contributors? Which had the least? 2) Which party had the most contributors? How many people contributed to party R? 3) Which district contributed the most? How much was it? Which party did it contribute to? 4) Which party received more contribution amount than the others? How much was it? 5) Who was the councilmember receiving the highest amount of contributions in total? Which party did he/she belong to? Who received the least? Which party did he/she belong to? 6) What type of contribution is the most popular one? What was the total amount of it? 7) What was the total amount of all the contributions? How much did Pitt receive in the type of ITM? 8) How many districts support Party R? List these districts. 9) What other information can you find from your spreadsheets? Give two examples (you need to show the specific dataumber, not general information). III 8:41 F r ck O SAID 2) Which party had the most contributors? How many people contributed to party R? 3) Which district contributed the most? How much was it? Which party did it contribute to? 4) Which party received more contribution amount than the others? How much was it? 5) Who was the councilmember receiving the highest amount of contributions in total? Which party did he/she belong to? Who received the least? Which party did he/she belong to? 6) What type of contribution is the most popular one? What was the total amount of it? 7) What was the total amount of all the contributions? How much did Pitt receive in the type of ITM? 8) How many districts support Party R? List these districts. 9) What other information can you find from your spreadsheets? Give two examples (you need to show the specific dataumber, not general information). 10) What do you think of this executive information system? Any comment/feedback on using the pivot table tool? Would you recommend other people adopt/use the spreadsheets you created? 2. Save your summary report, submit it to Blackboard. TIL 8:41 ocks A. Executive Information System Reporting for Decision Support The City of Highlands Ranch, Colorado, wishes to organize its campaign contributions records in a more strategic format. The city council is considering an executive information system that can show them overall views of the contribution information as well as give them the ability to access more detailed information. You have been hired to make recommendations about what reports should be available for the executive information system reporting. The following table is a list of the data fields for the reports in the proposed executive information system. To help you develop realistic reports, the city has provided you with a spreadsheet raw data file (CONTRIBUTION 2005.xls, available in attachment) that contains contribution details. Name Description III Colum n A B DATE CONTRIBUTOR DISTRICT The actual date that the contribution was made The name of the person or organization that made the contribution The district number that the councilperson belongs to 8:41 C D E F ck $ AL ONS DISTRICT The district number that the councilperson belongs to AMOUNT The amount of the contribution TYPE The description type of where the contribution amount was given COUNCILMEMBER The councilmember's name PARTY The councilperson's political party The city council would like to use the summarized, strategic drill down information for decision support. So, as a consultant, your goal is to develop different sets of summary reports that illustrate the overall information. o Your submission will include both the spreadsheets and a summary report. You need to submit two files. 111 For your spreadsheets submission: 1. Use the pivot table tool to develop the following spreadsheet reports (each has a 2D pivot table): a. Total number of contributors by DISTRICT and PARTY; (1 point) b. Total contribution amount by DISTRICT and PARTY; (1 point) C. Total contribution amount by COUNCILMEMBER and TYPE. (1 point) 8:41 ck SA C. Total contribution amount by COUNCILMEMBER and TYPE. (1 point) 2. Save each of above spreadsheet with a meaningful/descriptive name (each pivot table should be put into a separate sheet) (0.5 point), and change all the contribution amounts in standard currency format with $, and 2 decimal digits. (0.5 point) 3. If the decision makers in the city council would rather see information graphically than numerically for decision support, are you able to use the pivot chart tool to convert the above pivot tables into their corresponding summary graphs/charts? Please develop at least one graph/chart, add a meaningful, descriptive title for the graph, and format the contribution amounts in standard currency style. (1 point) 4. Save all your spreadsheets, submit the spreadsheet file to Blackboard. Instructions on how to develop a pivot table are covered in Building Pivot Table.ppt (posted under "Course Documents section online). 111 For you Summary Report submission: The Summary Report should be written in the format of Microsoft Word. (10 points; 1 point for each question) 8:41 ck O SA. For you Summary Report submission: The Summary Report should be written in the format of Microsoft Word. (10 points; 1 point for each question) 1. Answer the following questions in your report (write/type the questions then answer them): 1) Which district had the most contributors? Which had the least? 2) Which party had the most contributors? How many people contributed to party R? 3) Which district contributed the most? How much was it? Which party did it contribute to? 4) Which party received more contribution amount than the others? How much was it? 5) Who was the councilmember receiving the highest amount of contributions in total? Which party did he/she belong to? Who received the least? Which party did he/she belong to? 6) What type of contribution is the most popular one? What was the total amount of it? 7) What was the total amount of all the contributions? How much did Pitt receive in the type of ITM? 8) How many districts support Party R? List these districts. 9) What other information can you find from your spreadsheets? Give two examples (you need to show the specific dataumber, not general information). III 8:41 F r ck O SAID 2) Which party had the most contributors? How many people contributed to party R? 3) Which district contributed the most? How much was it? Which party did it contribute to? 4) Which party received more contribution amount than the others? How much was it? 5) Who was the councilmember receiving the highest amount of contributions in total? Which party did he/she belong to? Who received the least? Which party did he/she belong to? 6) What type of contribution is the most popular one? What was the total amount of it? 7) What was the total amount of all the contributions? How much did Pitt receive in the type of ITM? 8) How many districts support Party R? List these districts. 9) What other information can you find from your spreadsheets? Give two examples (you need to show the specific dataumber, not general information). 10) What do you think of this executive information system? Any comment/feedback on using the pivot table tool? Would you recommend other people adopt/use the spreadsheets you created? 2. Save your summary report, submit it to Blackboard. TILStep by Step Solution
There are 3 Steps involved in it
1 Expert Approved Answer
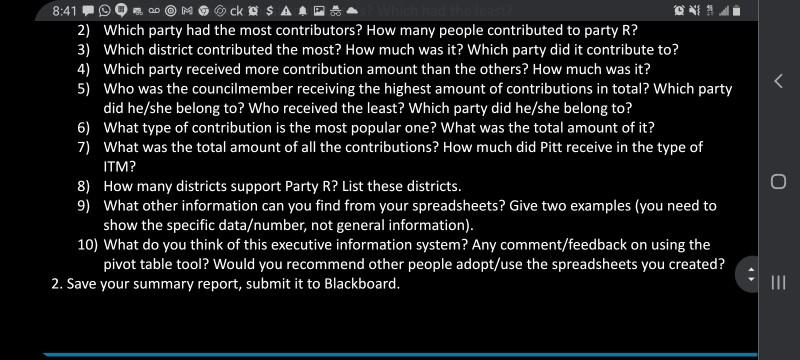
Step: 1 Unlock

Question Has Been Solved by an Expert!
Get step-by-step solutions from verified subject matter experts
Step: 2 Unlock
Step: 3 Unlock