

Question: Please follow the attached image: Using the same financial statements (Figure 2 and Figure 4), compute the breakeven point before and after the changes. Assume
Please follow the attached image:
- Using the same financial statements (Figure 2 and Figure 4), compute the breakeven point before and after the changes.
- Assume you use a different measure of break-even analysis. The answer to question 4 tells you the number of units the firm needs to sell to cover fixed costs. Assume you are interested in covering all cash outflows and, furthermore, will use only cash flow numbers rather than accounting numbers. The cash outflows to be covered are (Fixed costs amortization) plus interest payments.
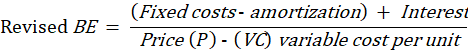
The formula for the revised break-even (BE) point is:
Apply this formula to Figure 2 to get the revised break-even point before the changes and Figure 4 to get the revised break-even point after the changes. (Note the value for amortization can be found as a footnote at the bottom of the two figures). Amortization of Figure 4 is: 2,800,000
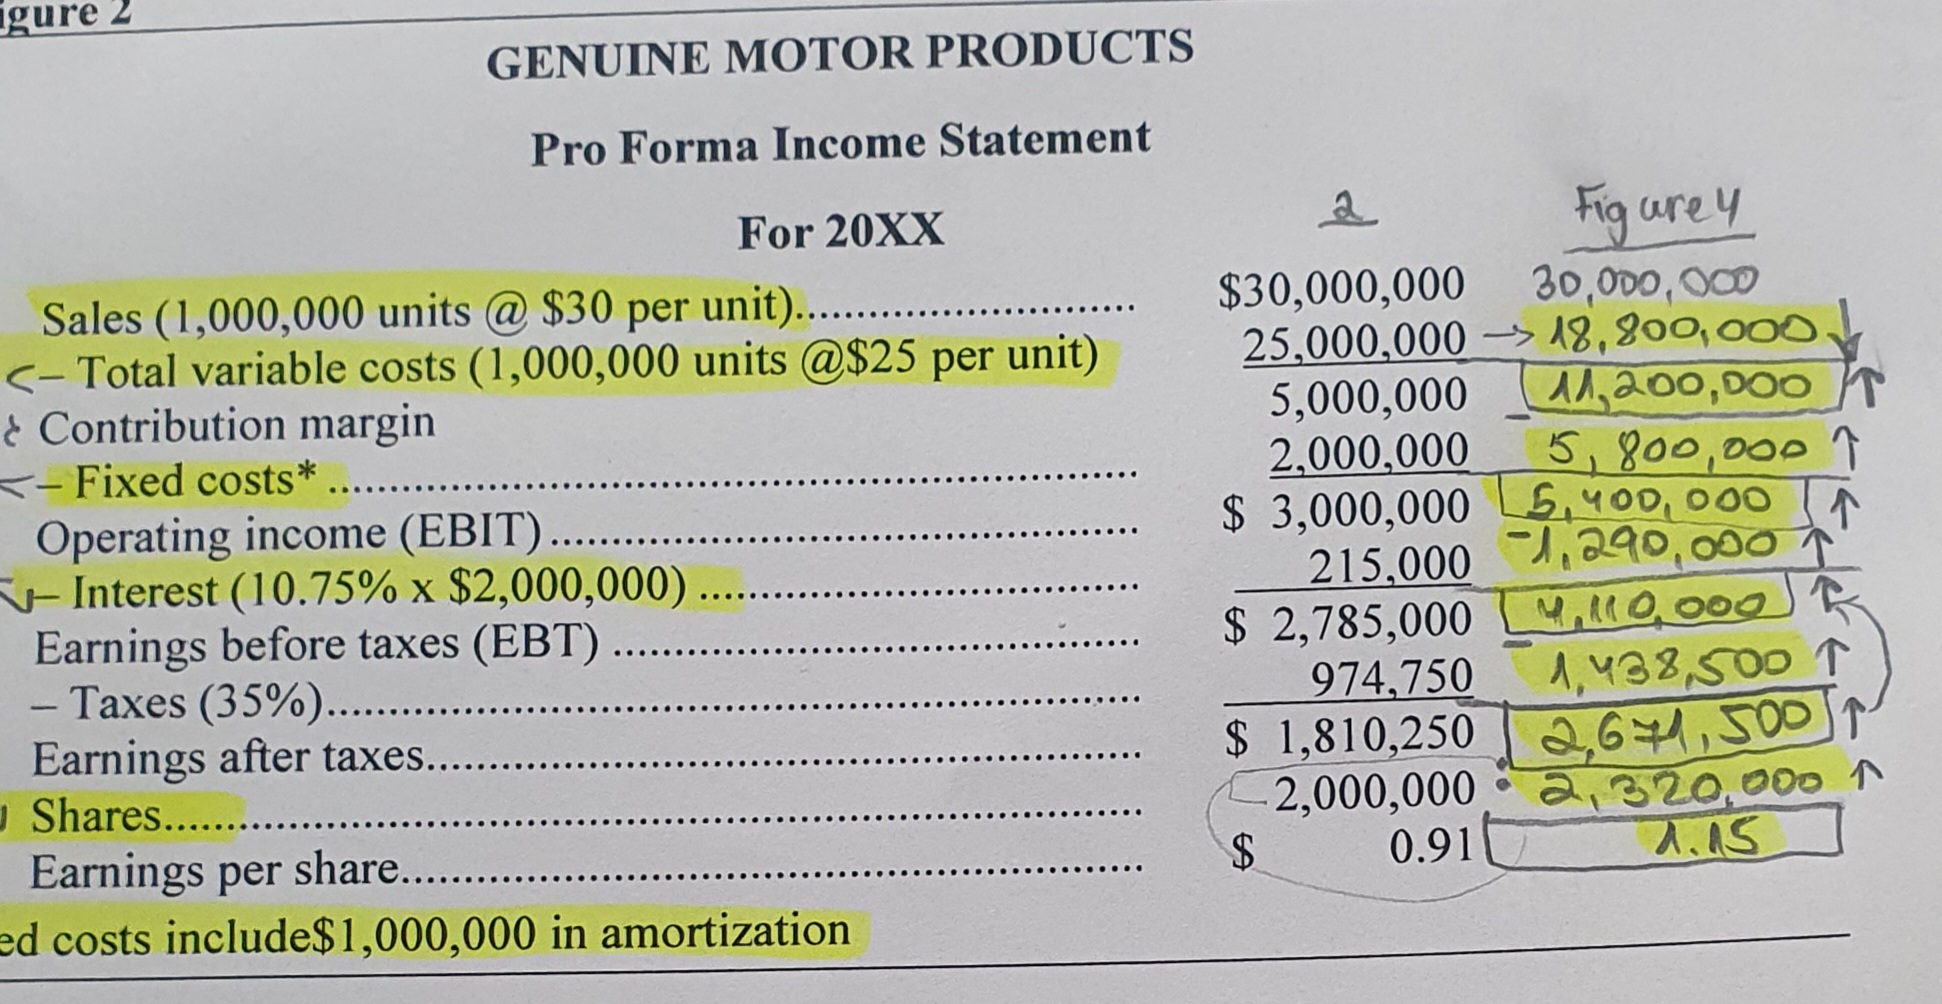
Revised BE=Price(P)(VC)variablecostperunit(Fixedcostsamortization)+Interes GENUINE MOTOR PRODUCTS Pro Forma Income Statement For 20XX Sales (1,000,000 units @ \$30 per unit) (1,000,000 units @\$25 per unit) Contribution margin
Step by Step Solution
There are 3 Steps involved in it
1 Expert Approved Answer
Step: 1 Unlock

Question Has Been Solved by an Expert!
Get step-by-step solutions from verified subject matter experts
Step: 2 Unlock
Step: 3 Unlock