

Question: please follow the below pattern Step 1: Find the probability of state of economy: - Boom = ?? - Normal = ?? - Recession =
please follow the below pattern Step 1: Find the probability of state of economy: - Boom = ?? - Normal = ?? - Recession = ?? show the answer in percentage.
Step 2: Find the wight for the stocks:
All the answer in the this step should be shown as percentage.
Step 3: Find the expected return fot Boom, Normal and Recession.
Step 4: Find the Expected return of Portfolio. (Show it in percentage)
Step 5: Find the Variance of Portfolio
Step 6: Find the Standard Deviation (Show it in percentage)
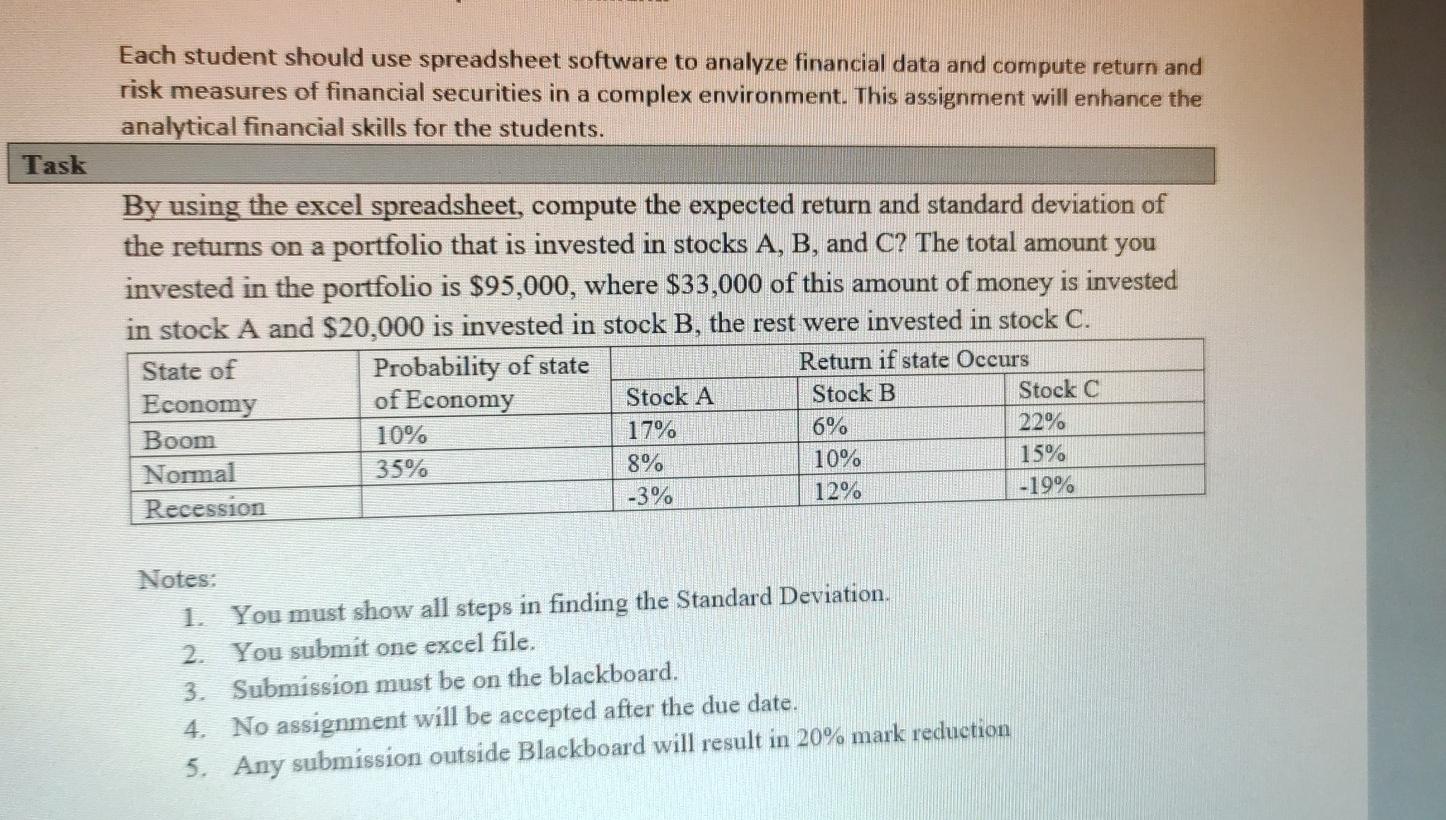
Each student should use spreadsheet software to analyze financial data and compute return and risk measures of financial securities in a complex environment. This assignment will enhance the analytical financial skills for the students. Task By using the excel spreadsheet, compute the expected return and standard deviation of the returns on a portfolio that is invested in stocks A, B, and C? The total amount you invested in the portfolio is $95,000, where $33,000 of this amount of money is invested in stock A and $20,000 is invested in stock B, the rest were invested in stock C. State of Probability of state Return if state Occurs Economy of Economy Stock A Stock B Stock C Boom 10% 17% 6% 22% Normal 35% 8% 10% 15% -3% Recession 12% -19% Notes: 1. You must show all steps in finding the Standard Deviation. 2. You submit one excel file. 3. Submission must be on the blackboard. 4. No assignment will be accepted after the due date. 5. Any submission outside Blackboard will result in 20% mark reduction
Step by Step Solution
There are 3 Steps involved in it

Get step-by-step solutions from verified subject matter experts