

Question: please give a simple and shorter answer 1. Design specification for a motor housing states that it should weigh between 24kg and 25kg. The process
please give a simple and shorter answer 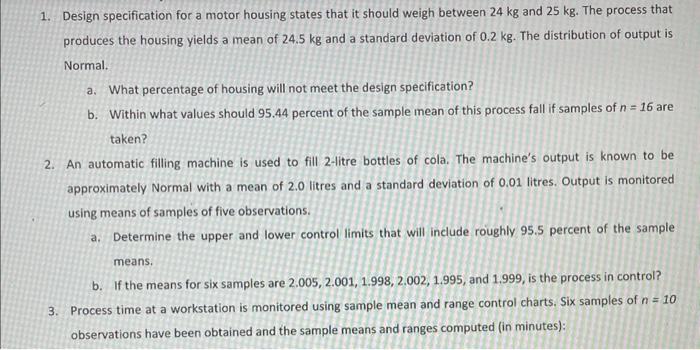
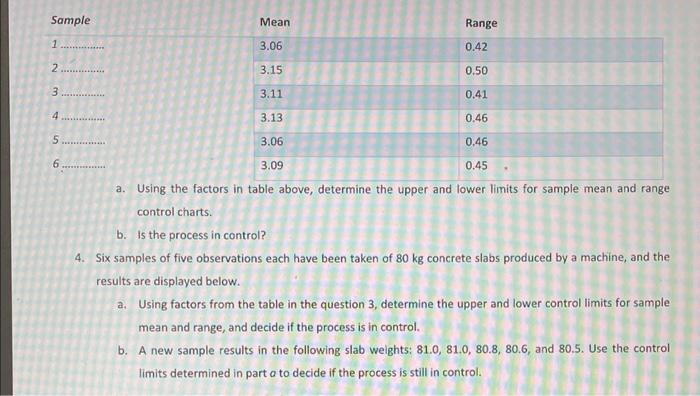
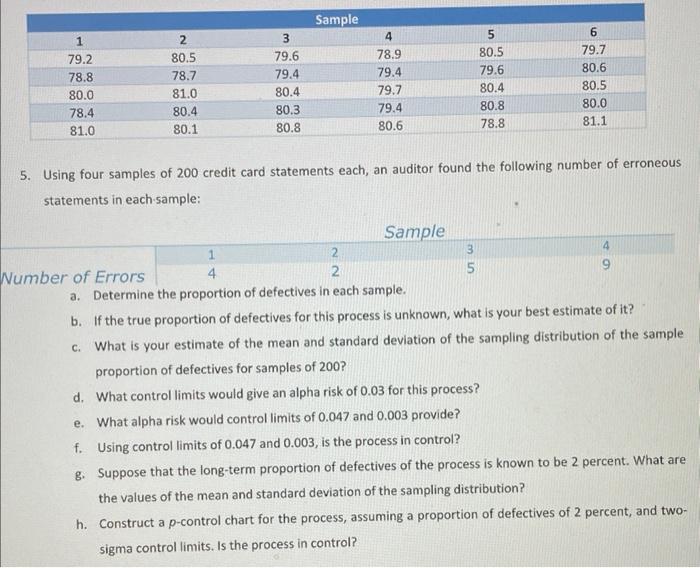
1. Design specification for a motor housing states that it should weigh between 24kg and 25kg. The process that produces the housing yields a mean of 24.5kg and a standard deviation of 0.2kg. The distribution of output is Normal. a. What percentage of housing will not meet the design specification? b. Within what values should 95.44 percent of the sample mean of this process fall if samples of n=16 are taken? 2. An automatic filling machine is used to fill 2 -litre bottles of cola. The machine's output is known to be approximately Normal with a mean of 2.0 litres and a standard deviation of 0.01 litres. Output is monitored using means of samples of five observations. a. Determine the upper and lower control limits that will include roughly 95.5 percent of the sample means. b. If the means for six samples are 2.005,2.001,1.998,2.002,1.995, and 1.999, is the process in control? 3. Process time at a workstation is monitored using sample mean and range control charts. Six samples of n=10 observations have been obtained and the sample means and ranges computed (in minutes): a. Using the factors in table above, determine the upper and lower limits for sample mean and range control charts. b. Is the process in control? 4. Six samples of five observations each have been taken of 80kg concrete slabs produced by a machine, and the results are displayed below. a. Using factors from the table in the question 3, determine the upper and lower control limits for sample mean and range, and decide if the process is in control. b. A new sample results in the following slab weights: 81.0,81.0,80.8,80.6, and 80.5. Use the control limits determined in part a to decide if the process is still in control. 5. Using four samples of 200 credit card statements each, an auditor found the following number of erroneous statements in each-sample: a. Determine the proportion of defectives in each sample. b. If the true proportion of defectives for this process is unknown, what is your best estimate of it? c. What is your estimate of the mean and standard deviation of the sampling distribution of the sample proportion of defectives for samples of 200 ? d. What control limits would give an alpha risk of 0.03 for this process? e. What alpha risk would control limits of 0.047 and 0.003 provide? f. Using control limits of 0.047 and 0.003, is the process in control? g. Suppose that the long-term proportion of defectives of the process is known to be 2 percent. What are the values of the mean and standard deviation of the sampling distribution? h. Construct a p-control chart for the process, assuming a proportion of defectives of 2 percent, and twosigma control limits. Is the process in control Step by Step Solution
There are 3 Steps involved in it
1 Expert Approved Answer
Step: 1 Unlock

Question Has Been Solved by an Expert!
Get step-by-step solutions from verified subject matter experts
Step: 2 Unlock
Step: 3 Unlock