

Question: Please give exact right answers please and thanks A boxplot for a sample data is shown below. There are no outliers. -32 10 40 110
Please give exact right answers please and thanks
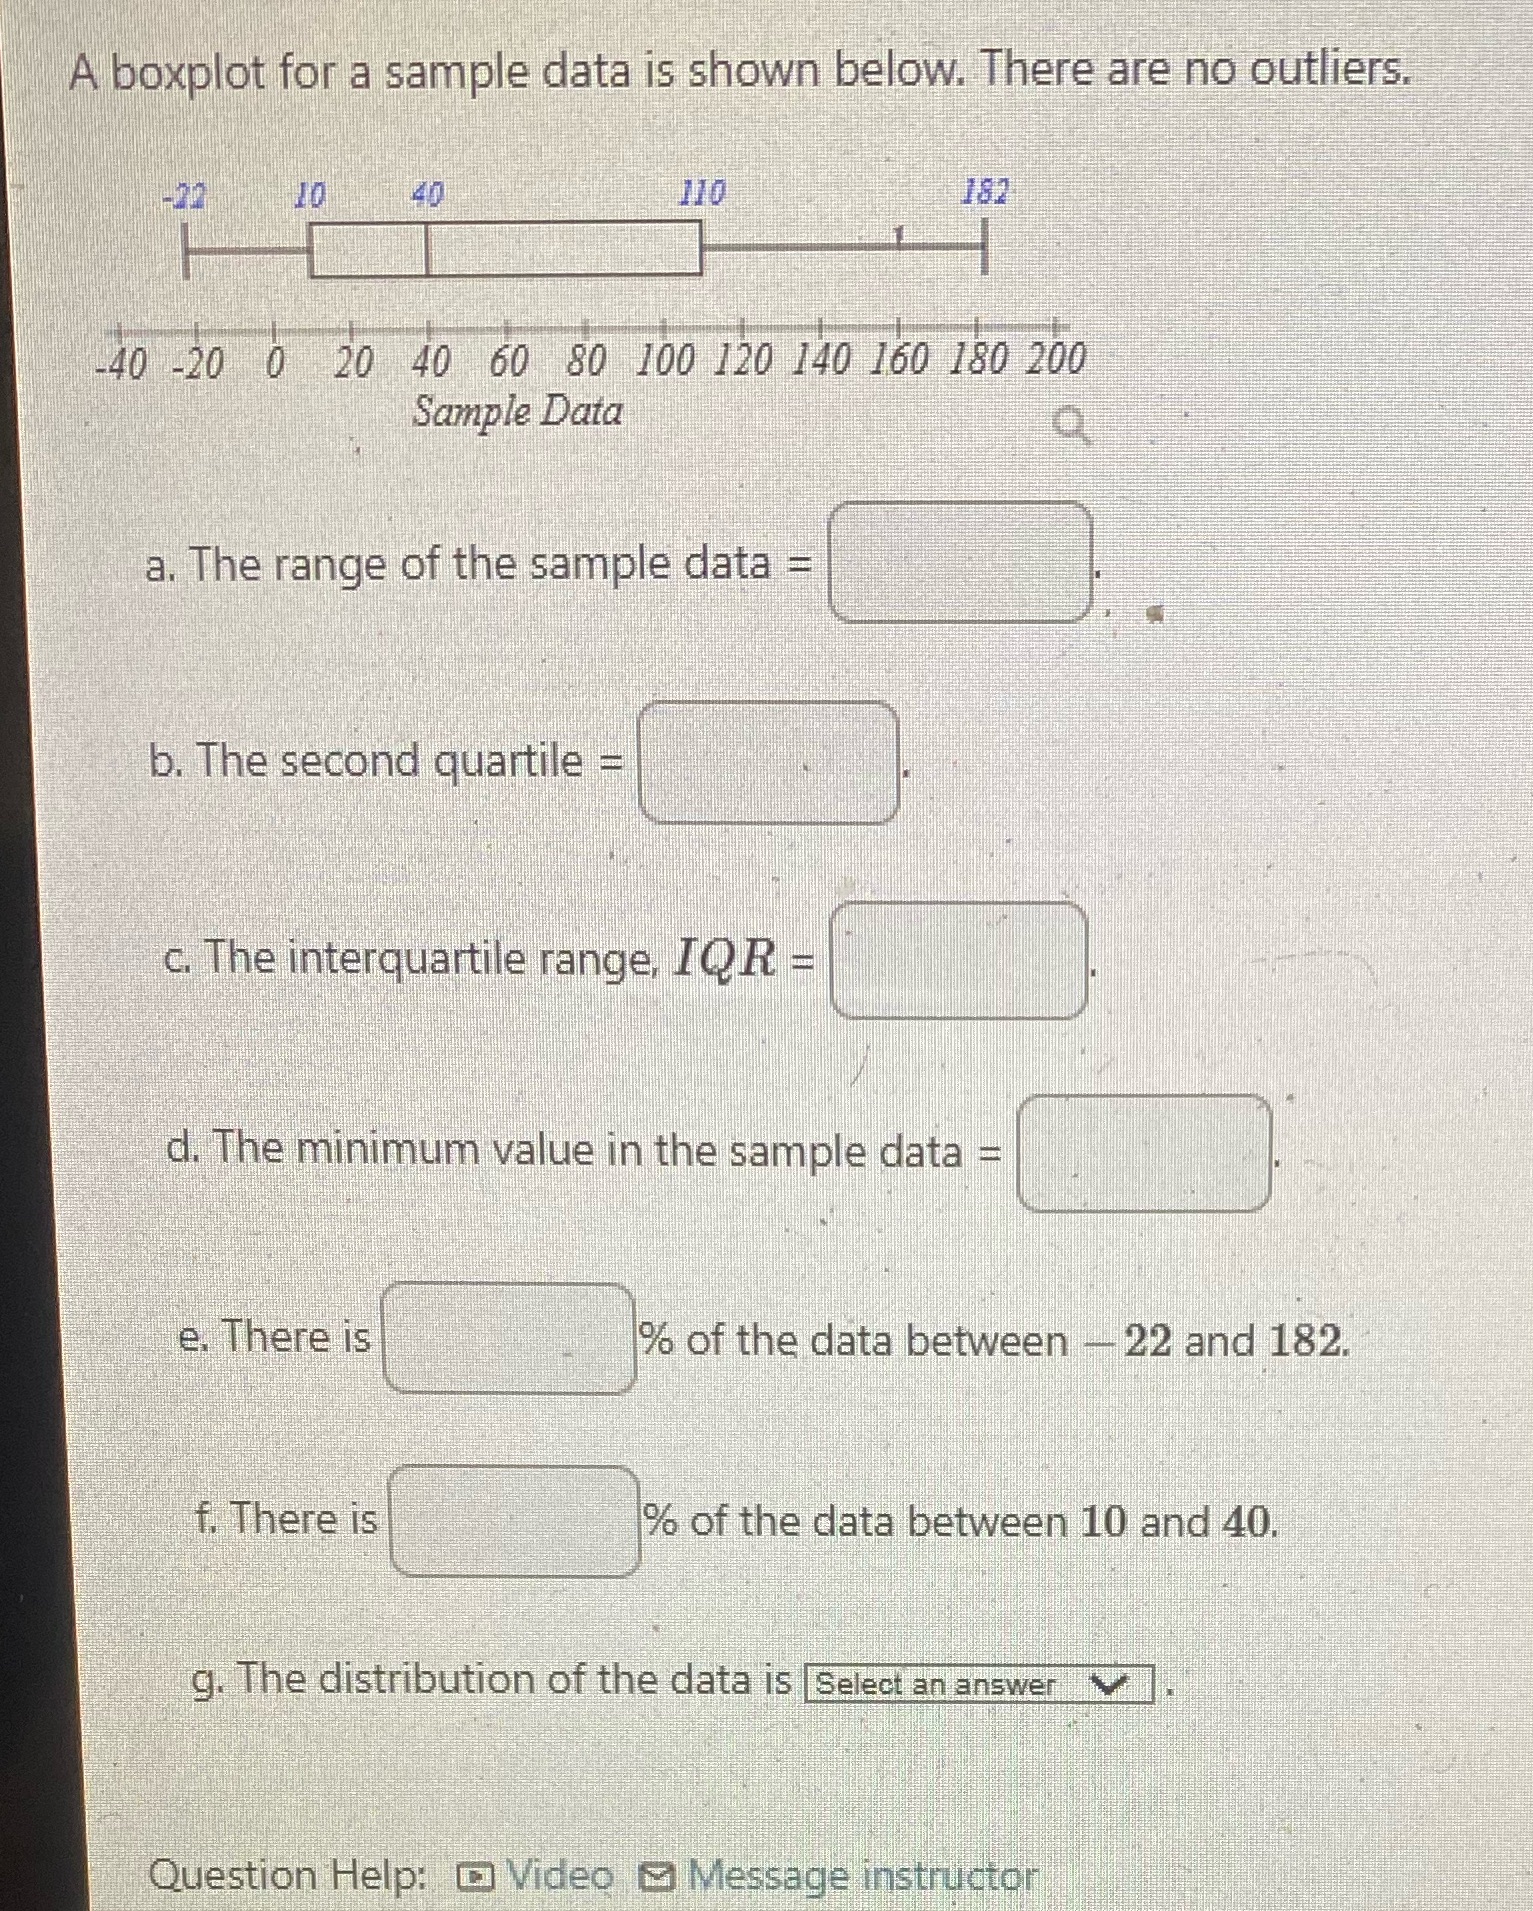
A boxplot for a sample data is shown below. There are no outliers. -32 10 40 110 182 -40 -20 0 20 40 60 80 100 120 140 160 180 200 Sample Data a. The range of the sample data = b. The second quartile = c. The interquartile range, IQR = d. The minimum value in the sample data = e. There is % of the data between - 22 and 182. f. There is % of the data between 10 and 40. g. The distribution of the data is Select an answer \\ Question Help: @ Video ) Message instructor
Step by Step Solution
There are 3 Steps involved in it
1 Expert Approved Answer
Step: 1 Unlock

Question Has Been Solved by an Expert!
Get step-by-step solutions from verified subject matter experts
Step: 2 Unlock
Step: 3 Unlock