

Question: please give me a code that completes the assessment below thank you you Mechanical Spring Deflection Some tests are run where a ball of a
please give me a code that completes the assessment below thank you you
Mechanical Spring Deflection
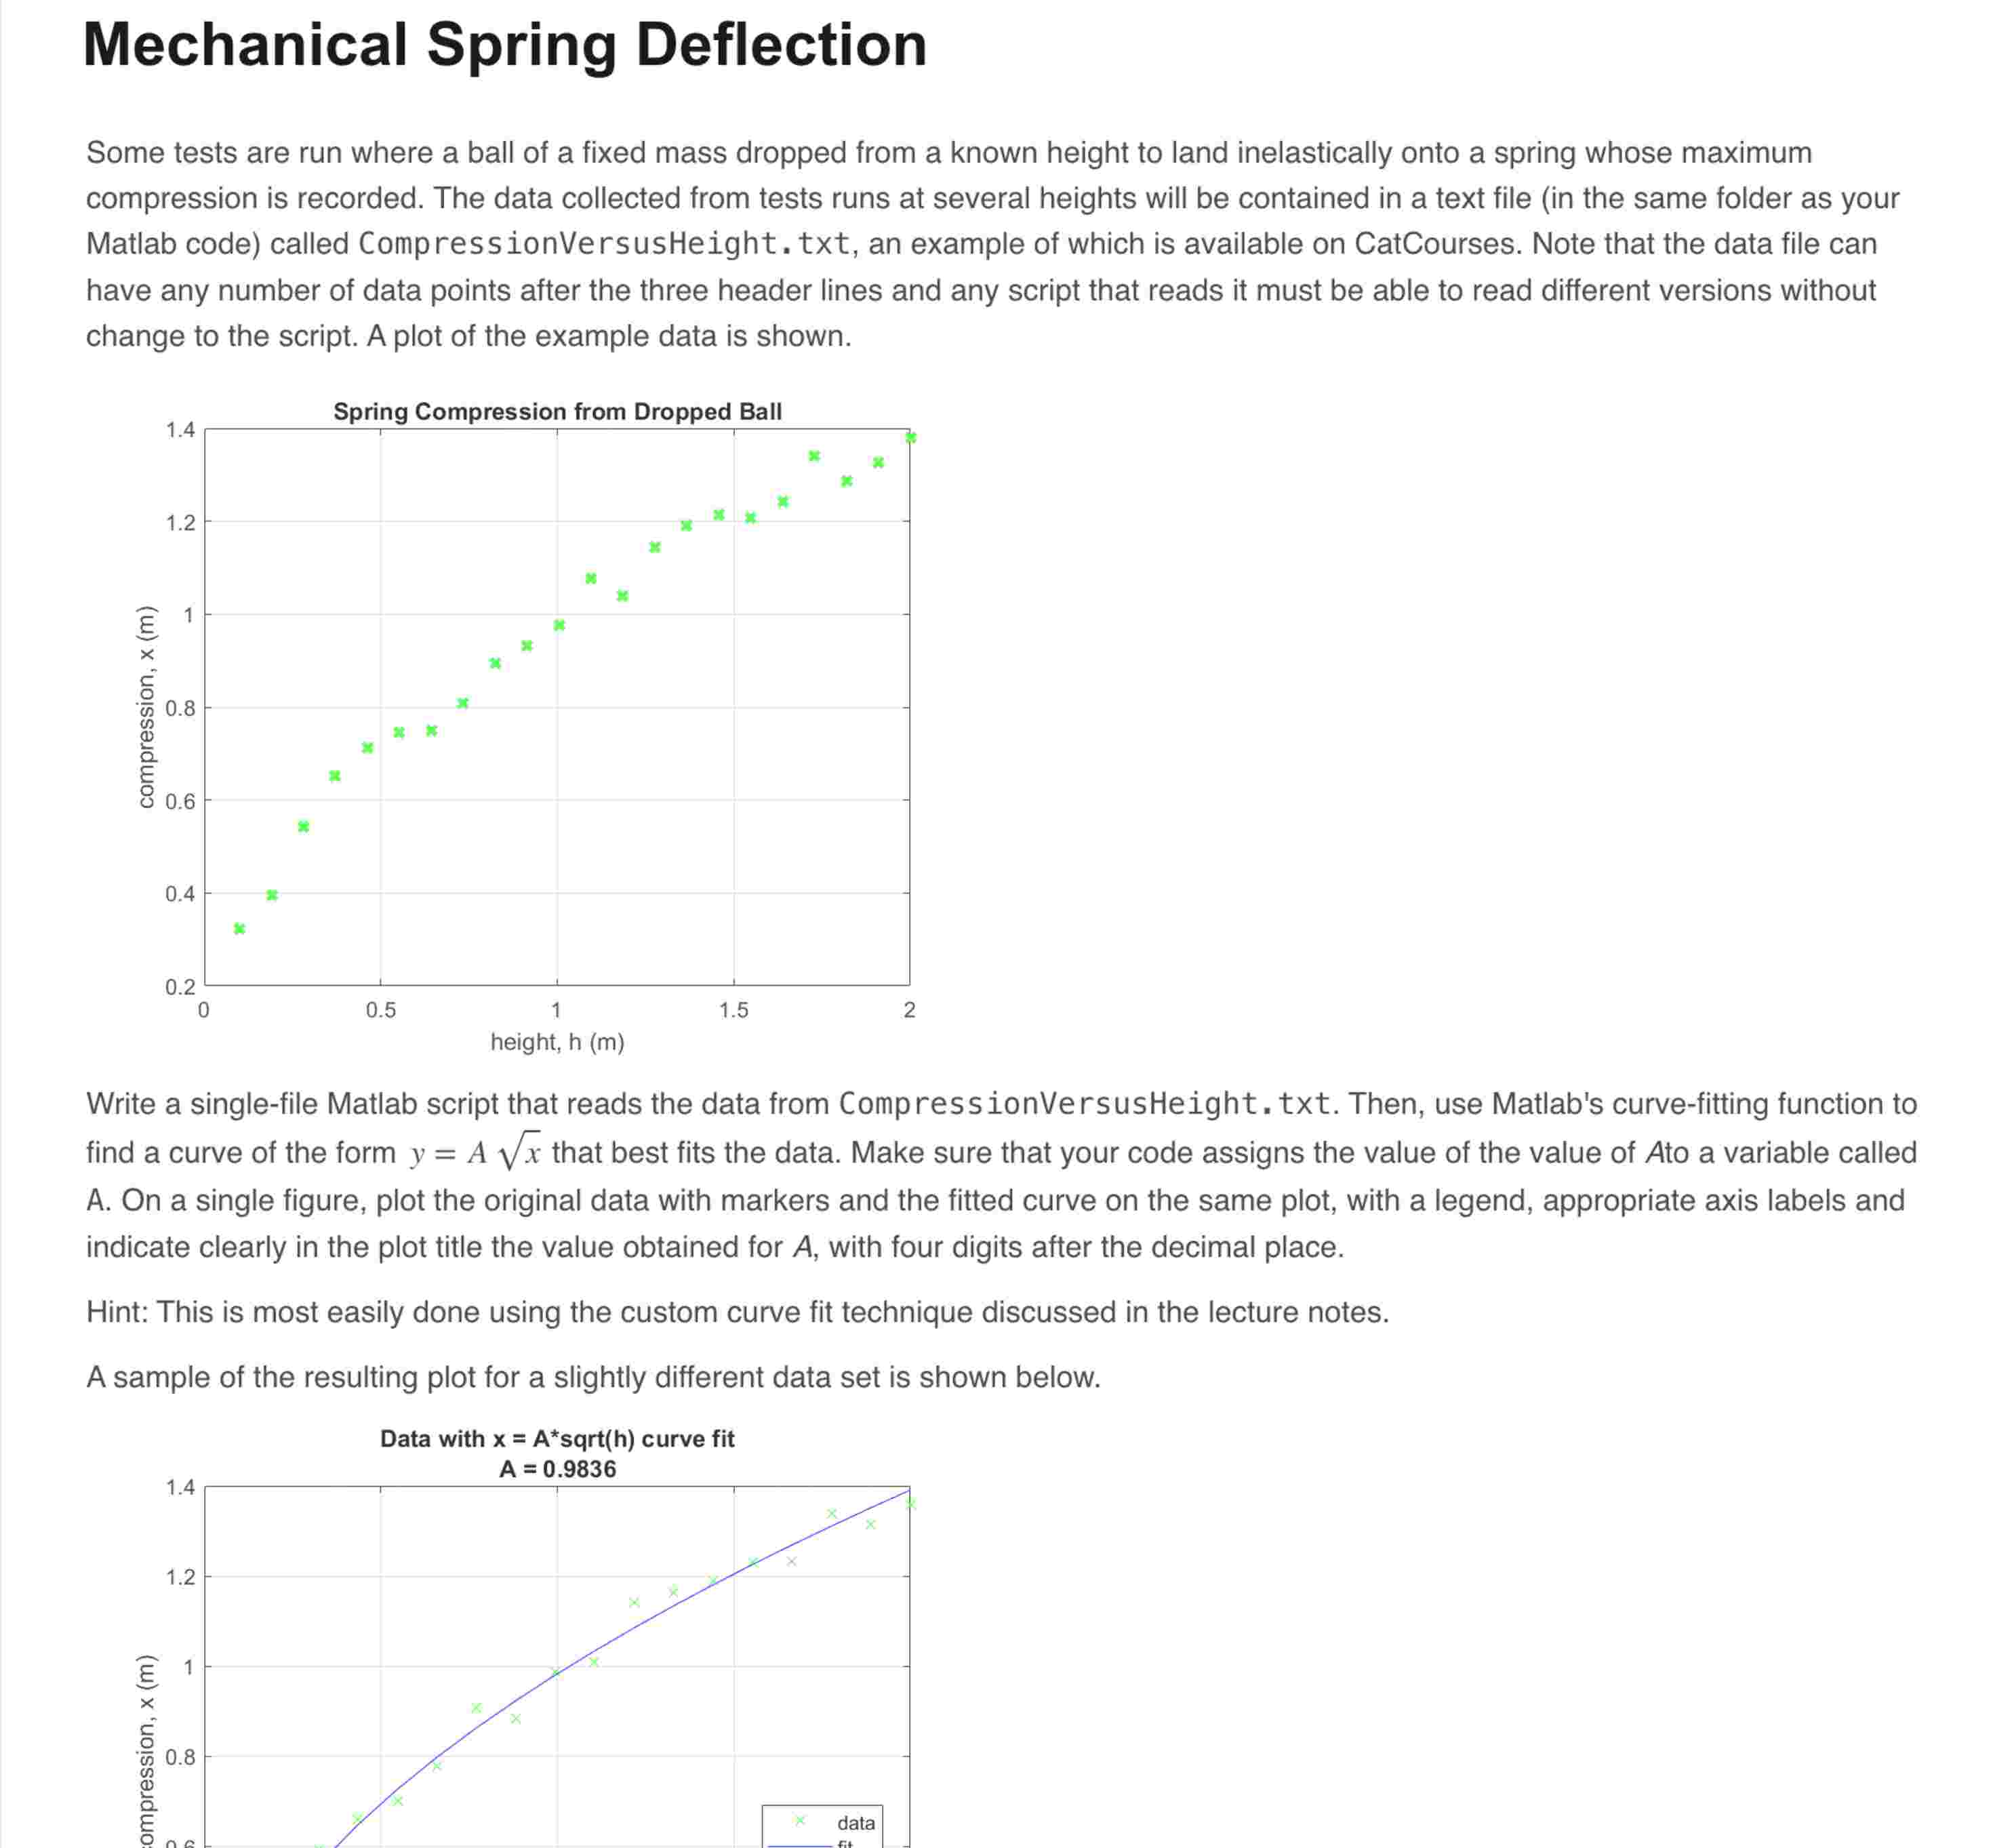
Some tests are run where a ball of a fixed mass dropped from a known height to land inelastically onto a spring whose maximum compression is recorded. The data collected from tests runs at several heights will be contained in a text file in the same folder as your Matlab code called CompressionVersusHeight.txt an example of which is available on CatCourses. Note that the data file can have any number of data points after the three header lines and any script that reads it must be able to read different versions without change to the script. A plot of the example data is shown.
Write a singlefile Matlab script that reads the data from CompressionVersusHeight. txt Then, use Matlab's curvefitting function to find a curve of the form yA sqrtx that best fits the data. Make sure that your code assigns the value of the value of Ato a variable called A On a single figure, plot the original data with markers and the fitted curve on the same plot, with a legend, appropriate axis labels and indicate clearly in the plot title the value obtained for A with four digits after the decimal place.
Hint: This is most easily done using the custom curve fit technique discussed in the lecture notes.
A sample of the resulting plot for a slightly different data set is shown below.
Write a singlefile Matlab script that reads the data from CompressionVersusHeight. txt Then, use Matlab's curvefitting function to
find a curve of the form yAsqrtx that best fits the data. Make sure that your code assigns the value of the value of Ato a variable called
A On a single figure, plot the original data with markers and the fitted curve on the same plot, with a legend, appropriate axis labels and
indicate clearly in the plot title the value obtained for A with four digits after the decimal place.
Hint: This is most easily done using the custom curve fit technique discussed in the lecture notes.
A sample of the resulting plot for a slightly different data set is shown below.
Data with xA sqrth curve fit
A
reads data
Error using fitiFit line X Y and WEIGHTS cannot have NaN values. Error in fit line fitobj goodness, output,
convmsg iFit xdatain, ydatain, fittypeobj, Error in solution line fitResult fith x model, 'StartPoint', startPoint;
Fit the data using the model
Data must be read from 'CompressionVersusHeight.txt
Feedback is shown for the initial error only, as subsequent failures may be due to the first error Show Feedback
check coefficient
check plot title
check plot legend
Step by Step Solution
There are 3 Steps involved in it
1 Expert Approved Answer
Step: 1 Unlock

Question Has Been Solved by an Expert!
Get step-by-step solutions from verified subject matter experts
Step: 2 Unlock
Step: 3 Unlock