Question: Please give me the correct answer as soon as possible! A manager wishes to build a control chart for a process. A total of five

Please give me the correct answer as soon as possible! Please give me the correct answer as soon as
Please give me the correct answer as soon as
A manager wishes to build a control chart for a process. A total of five (OS) samples are collected with four (04) observations within each sample. The sample means (X-bar) are; 14.09, 13.94,16.86, 20.00, and 16.64 respectively. Also, the corresponding ranges are; 90,7.73, 441, 7.56, and 3.49 respectively. The lower and upper control limits of the x-bar chart are respectively Select one: a. None is correct b. 11.47, 21.14 c. 11.29, 20.65 d. 11.44, 20.66 10 e 11.47. 16.55 Control Chart Table Sample Size Factor for X-Chart Factors for R-Chart (n) A2 03 D4 z-value Confidence level % 2 3 4 3.27 257 2.28 2.11 2.00 1.92 1.86 8888 1.65 1.96 2.05 2.17 233 2.58 5 6 7 8 1.88 1.02 0.73 0.58 0.48 0.42 0.37 0.34 0.31 0.29 0.27 0.25 0.24 0.22 0.00 0.00 0.00 0.00 0.00 0.08 0.14 0.18 0.22 0.26 0.28 0.31 0.33 0.35 9 10 11 12 1.82 1.78 174 1.72 1.69 1.67 1.65 13 14 15

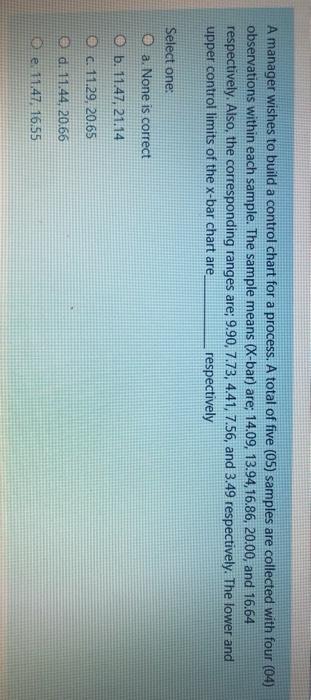
Step by Step Solution

There are 3 Steps involved in it

1 Expert Approved Answer
Step: 1 Unlock blur-text-image
Question Has Been Solved by an Expert!

Get step-by-step solutions from verified subject matter experts

Step: 2 Unlock
Step: 3 Unlock

Students Have Also Explored These Related General Management Questions!