

Question: Please give the excel calculation Assignment Construct two different portfolios. In each portfolio you should have at least 5 stocks. In portfolio one, you should
Please give the excel calculation
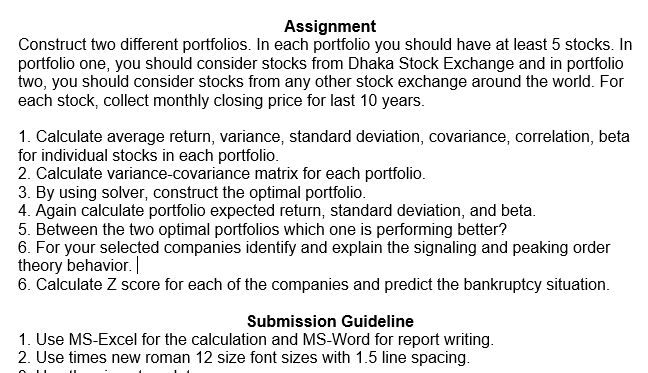
Assignment Construct two different portfolios. In each portfolio you should have at least 5 stocks. In portfolio one, you should consider stocks from Dhaka Stock Exchange and in portfolio two, you should consider stocks from any other stock exchange around the world. For each stock, collect monthly closing price for last 10 years. 1. Calculate average return, variance, standard deviation, covariance, correlation, beta for individual stocks in each portfolio. 2. Calculate variance-covariance matrix for each portfolio. 3. By using solver, construct the optimal portfolio. 4. Again calculate portfolio expected return, standard deviation, and beta. 5. Between the two optimal portfolios which one is performing better? 6. For your selected companies identify and explain the signaling and peaking order theory behavior. | 6. Calculate Z score for each of the companies and predict the bankruptcy situation. Submission Guideline 1. Use MS-Excel for the calculation and MS-Word for report writing. 2. Use times new roman 12 size font sizes with 1.5 line spacing. Assignment Construct two different portfolios. In each portfolio you should have at least 5 stocks. In portfolio one, you should consider stocks from Dhaka Stock Exchange and in portfolio two, you should consider stocks from any other stock exchange around the world. For each stock, collect monthly closing price for last 10 years. 1. Calculate average return, variance, standard deviation, covariance, correlation, beta for individual stocks in each portfolio. 2. Calculate variance-covariance matrix for each portfolio. 3. By using solver, construct the optimal portfolio. 4. Again calculate portfolio expected return, standard deviation, and beta. 5. Between the two optimal portfolios which one is performing better? 6. For your selected companies identify and explain the signaling and peaking order theory behavior. | 6. Calculate Z score for each of the companies and predict the bankruptcy situation. Submission Guideline 1. Use MS-Excel for the calculation and MS-Word for report writing. 2. Use times new roman 12 size font sizes with 1.5 line spacing
Step by Step Solution
There are 3 Steps involved in it

Get step-by-step solutions from verified subject matter experts