

Question: please give the P-Chart associated with problem 3.10 and the X-bar chart associated with 3.17. please show the UCL,CL, and LCL as well as the
please give the P-Chart associated with problem 3.10 and the X-bar chart associated with 3.17. please show the UCL,CL, and LCL as well as the data points associated with each sample 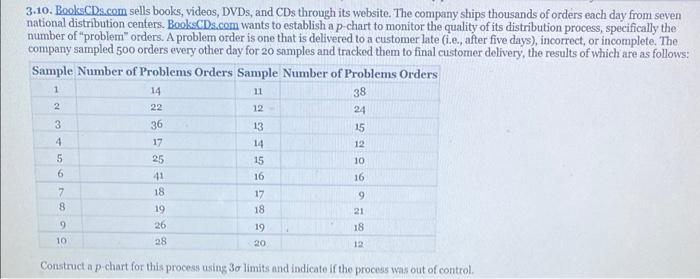
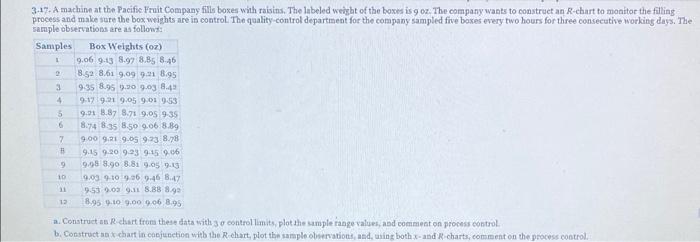
3.10. Books CDs.com sells books, videos, DVDs, and CDs through its website. The company ships thousands of orders each day from seven national distribution centers. Books CDs.com wants to establish a p-chart to monitor the quality of its distribution process, specifically the number of "problem" orders. A problem order is one that is delivered to a customer late (1.0, after five days), incorrect , or incomplete. The company sampled 500 orders every other day for 20 samples and tracked them to final customer delivery, the results of which are as follows: Sample Number of Problems Orders Sample Number of Problems Orders 14 1 11 38 2 22 12 24 3 4 36 17 25 41 18 13 14 15 16 15 12 10 5 6 16 7 8 9 17 18 21 19 26 28 9 10 18 19 20 12 Construct a p-chart for this process using 3o limits and indicate if the process was out of control 2 3:17. A machine at the Pacific Fruit Company fills boxes with raisins. The labeled weight of the boxes is g oz. The company wants to construct an R-chart to monitor the filling process and make sure the box weights are in control. The quality control department for the company sampled five boxes every two hours for three consecutive working days. The sample observations are as follows: Samples Box Weights (oz) 9.06 9.13 8.92 8.85 8.46 8.52 8.61 9.09 98.95 3 935 8.95 1.30 9.03 8.43 4 9.17 9.2 9.05 9.01 9:53 5 9.01 3.87 8.75 9.05 9-35 8.74 8.35 8.50 9.06 8.89 7 9.00 9.1 9.65 923 8.78 9.15 9.20 923 915 9.06 9 9:08 8.90 8.81 9.05 1.13 9.03 910 926 0.46 8.47 9.53 0.03 9.11 8.88 8.99 8.95 0.10 9.00 9.06 8.95 a. Construct a R chart from these data with 3 o controllimits, plot the sample range values, and comment on process control b. Construct ex chart in conjunction with the chart, plot the sample obrvations, and using both x and Richarts, comment on the process control 10 12
Step by Step Solution
There are 3 Steps involved in it
1 Expert Approved Answer
Step: 1 Unlock

Question Has Been Solved by an Expert!
Get step-by-step solutions from verified subject matter experts
Step: 2 Unlock
Step: 3 Unlock