

Question: Please go step by step and create the graph manually, not using excel. 1. Given the following flow rate and BOD concentration data: derived data
Please go step by step and create the graph manually, not using excel. 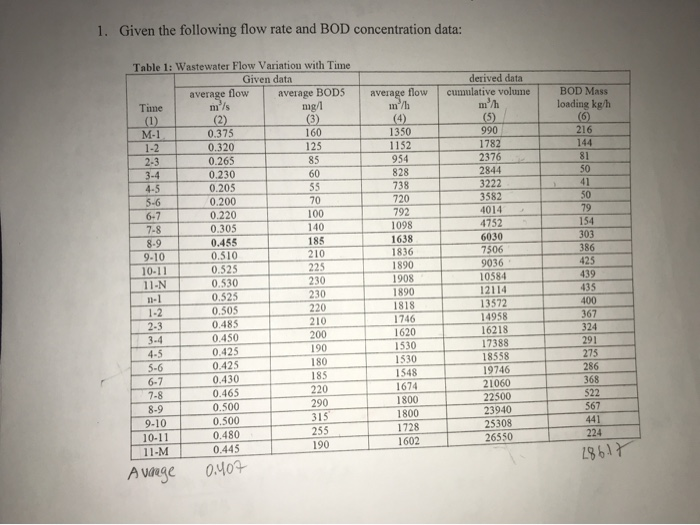
1. Given the following flow rate and BOD concentration data: derived data cumulative volume Table 1: Wastewater Flow Variation with Time Given data average flow average BODS Time m/s mg/1 (1) (2) (3) M-1 0.375 160 1-2 0.320 125 2-3 0.265 85 3-4 0.230 60 4-5 0.205 55 5-6 0.200 70 6-7 0.220 100 7-8 0.305 140 8-9 0.455 185 9-10 0.510 210 10-11 0.525 225 11-N 0.530 230 11-1 0.525 230 1-2 0.505 220 2-3 0.485 210 3.4 0.450 200 0.425 190 5-6 0.425 6-7 0.430 185 7-8 0.465 220 8-9 0.500 290 9-10 0.500 315 10-11 0.480 255 11-M 0.445 average flow in /h (4) 1350 1152 954 828 738 720 792 1098 1638 1836 1890 1908 1890 1818 1746 1620 1530 1530 1548 1674 1800 1800 1728 1602 (5) 990 1782 2376 2844 3222 3582 4014 4752 6030 7506 9036 10584 12114 13572 14958 16218 17388 18558 19746 21060 22500 23940 25308 26550 BOD Mass loading kg/h (6) 216 144 81 50 41 50 79 154 303 386 425 439 435 400 367 324 291 275 286 368 522 567 441 224 4-5 180 IND 190 286.17 Avaage 0.407
Step by Step Solution
There are 3 Steps involved in it

Get step-by-step solutions from verified subject matter experts