

Question: **please graph using excel and include formula** 5. An investor buys for $3 a 3-month European call with a strike price of $30 and sells
 **please graph using excel and include formula**
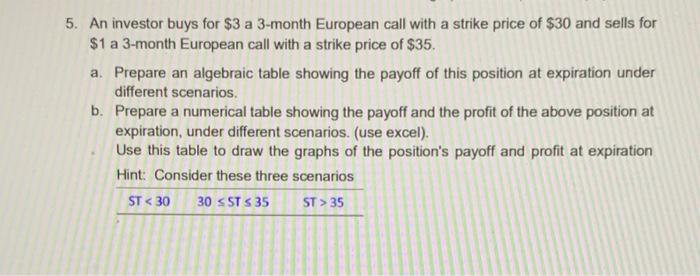
5. An investor buys for $3 a 3-month European call with a strike price of $30 and sells for $1 a 3-month European call with a strike price of $35. a. Prepare an algebraic table showing the payoff of this position at expiration under different scenarios. b. Prepare a numerical table showing the payoff and the profit of the above position at expiration, under different scenarios. (use excel). Use this table to draw the graphs of the position's payoff and profit at expiration Hint: Consider these three scenarios ST 35
Step by Step Solution
There are 3 Steps involved in it
1 Expert Approved Answer
Step: 1 Unlock

Question Has Been Solved by an Expert!
Get step-by-step solutions from verified subject matter experts
Step: 2 Unlock
Step: 3 Unlock