

Question: Please help! #14) Please consider the following graph; calculate the following areas: total revenue, the consumer surplus; the producer surplus; the area of total cost,
Please help!
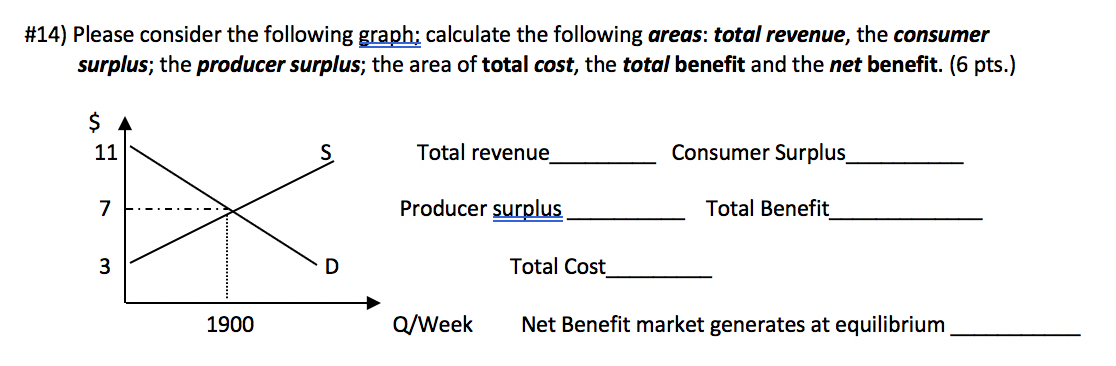
#14) Please consider the following graph; calculate the following areas: total revenue, the consumer surplus; the producer surplus; the area of total cost, the total benefit and the net benefit. (6 pts.) 11 S Total revenue Consumer Surplus 7 Producer surplus Total Benefit W D Total Cost 1900 Q/Week Net Benefit market generates at equilibrium
Step by Step Solution
There are 3 Steps involved in it
1 Expert Approved Answer
Step: 1 Unlock

Question Has Been Solved by an Expert!
Get step-by-step solutions from verified subject matter experts
Step: 2 Unlock
Step: 3 Unlock