

Question: PLEASE HELP 3. You are given the following information: Use the Variance - Covariance matrix in the Excel file: Efficient Portfolios Data Construct a model
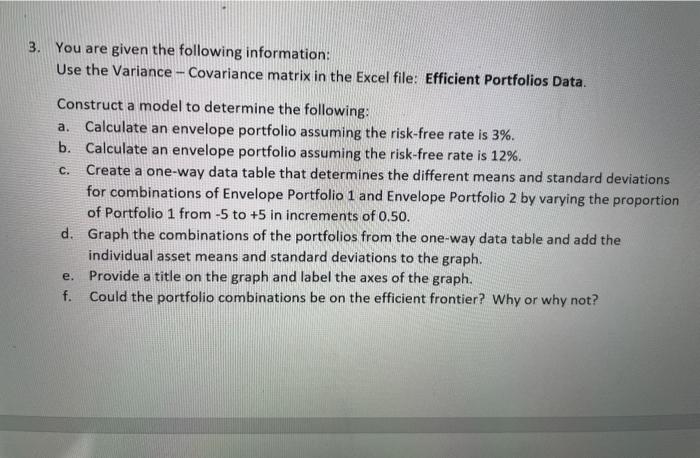
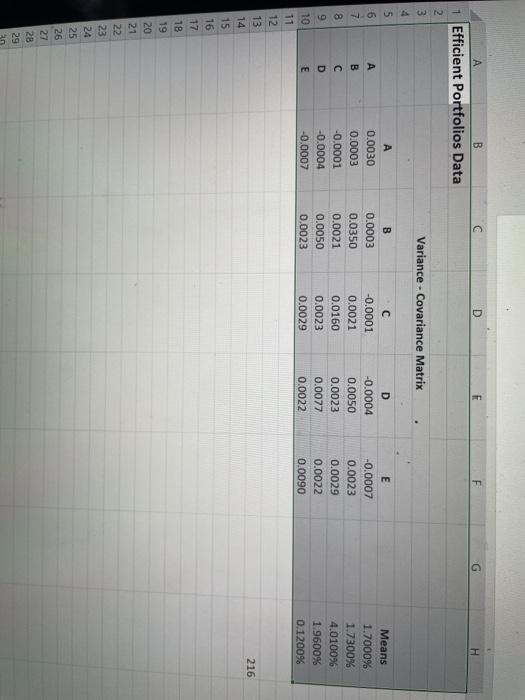
3. You are given the following information: Use the Variance - Covariance matrix in the Excel file: Efficient Portfolios Data Construct a model to determine the following: a. Calculate an envelope portfolio assuming the risk-free rate is 3%. b. Calculate an envelope portfolio assuming the risk-free rate is 12%. C. Create a one-way data table that determines the different means and standard deviations for combinations of Envelope Portfolio 1 and Envelope Portfolio 2 by varying the proportion of Portfolio 1 from 5 to +5 in increments of 0.50. d. Graph the combinations of the portfolios from the one-way data table and add the individual asset means and standard deviations to the graph. Provide a title on the graph and label the axes of the graph. f. Could the portfolio combinations be on the efficient frontier? Why or why not? C D H A B Efficient Portfolios Data Variance - Covariance Matrix . 4 5 6 B D 0.0030 0.0003 -0.0001 -0.0004 -0.0007 B 0.0003 0.0350 0.0021 0.0050 0.0023 -0.0001 0.0021 0.0160 0.0023 0.0029 D -0.0004 0.0050 0.0023 0.0077 0.0022 E -0.0007 0.0023 0.0029 0.0022 0.0090 Means 1.7000% 1.7300% 4.0100% 1.9600% 0.1200% E 216 8 9 10 11 12 13 14 15 16 17 18 19 20 21 22 23 24 25 26 27 28 29 3. You are given the following information: Use the Variance - Covariance matrix in the Excel file: Efficient Portfolios Data Construct a model to determine the following: a. Calculate an envelope portfolio assuming the risk-free rate is 3%. b. Calculate an envelope portfolio assuming the risk-free rate is 12%. C. Create a one-way data table that determines the different means and standard deviations for combinations of Envelope Portfolio 1 and Envelope Portfolio 2 by varying the proportion of Portfolio 1 from 5 to +5 in increments of 0.50. d. Graph the combinations of the portfolios from the one-way data table and add the individual asset means and standard deviations to the graph. Provide a title on the graph and label the axes of the graph. f. Could the portfolio combinations be on the efficient frontier? Why or why not? C D H A B Efficient Portfolios Data Variance - Covariance Matrix . 4 5 6 B D 0.0030 0.0003 -0.0001 -0.0004 -0.0007 B 0.0003 0.0350 0.0021 0.0050 0.0023 -0.0001 0.0021 0.0160 0.0023 0.0029 D -0.0004 0.0050 0.0023 0.0077 0.0022 E -0.0007 0.0023 0.0029 0.0022 0.0090 Means 1.7000% 1.7300% 4.0100% 1.9600% 0.1200% E 216 8 9 10 11 12 13 14 15 16 17 18 19 20 21 22 23 24 25 26 27 28 29
Step by Step Solution
There are 3 Steps involved in it

Get step-by-step solutions from verified subject matter experts