

Question: please show work in excel 3. Use the Variance-Covariance matrix in the Excel file: Efficient Portfolios Data. Construct a model to determine the following: a.
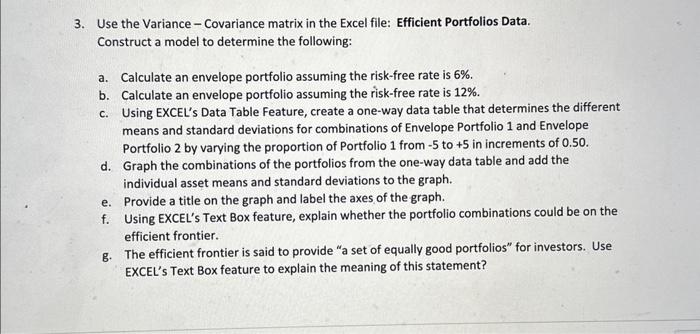
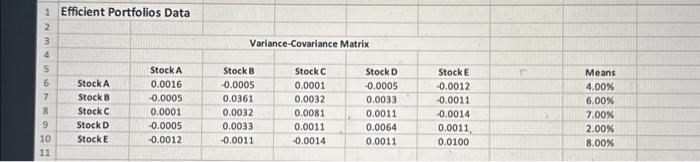
3. Use the Variance-Covariance matrix in the Excel file: Efficient Portfolios Data. Construct a model to determine the following: a. Calculate an envelope portfolio assuming the risk-free rate is 6%. b. Calculate an envelope portfolio assuming the risk-free rate is 12%. c. Using EXCEL's Data Table Feature, create a one-way data table that determines the different means and standard deviations for combinations of Envelope Portfolio 1 and Envelope Portfolio 2 by varying the proportion of Portfolio 1 from -5 to +5 in increments of 0.50 . d. Graph the combinations of the portfolios from the one-way data table and add the individual asset means and standard deviations to the graph. e. Provide a title on the graph and label the axes of the graph. f. Using EXCEL's Text Box feature, explain whether the portfolio combinations could be on the efficient frontier. g. The efficient frontier is said to provide "a set of equally good portfolios" for investors. Use EXCEL's Text Box feature to explain the meaning of this statement? Efficient Portfolios Data Variance-Covariance Matrix \begin{tabular}{|c|c|c|c|c|c|c|c|c|} \hline & & StockA & Stock B & Stock C & Stock D & StockE & T & Means \\ \hline 6 & StockA & 0.0016 & -0.0005 & 0.0001 & -0.0005 & -0.0012 & 4.00% \\ \hline 8 & StockB & -0.0005 & 0.0361 & 0.0032 & 0.0033 & -0.0011 & 6.00% \\ \hline 8 & StockC & 0.0001 & 0.0032 & 0.0081 & 0.0011 & -0.0014 & 7.00% \\ \hline 9 & StockD & -0.0005 & 0.0033 & 0.0011 & 0.0064 & 0.0011 & 2.00% \\ \hline 10 & StockE & -0.0012 & -0.0011 & -0.0014 & 0.0011 & 0.0100 & 8.00% \\ \hline 11 & & & & & & & \\ \hline \end{tabular}
Step by Step Solution
There are 3 Steps involved in it

Get step-by-step solutions from verified subject matter experts