

Question: please help 5a. Begin your answer with the list of assumptions underlying the construction of the production possibilities curve. Explain how (if at all) each
please help
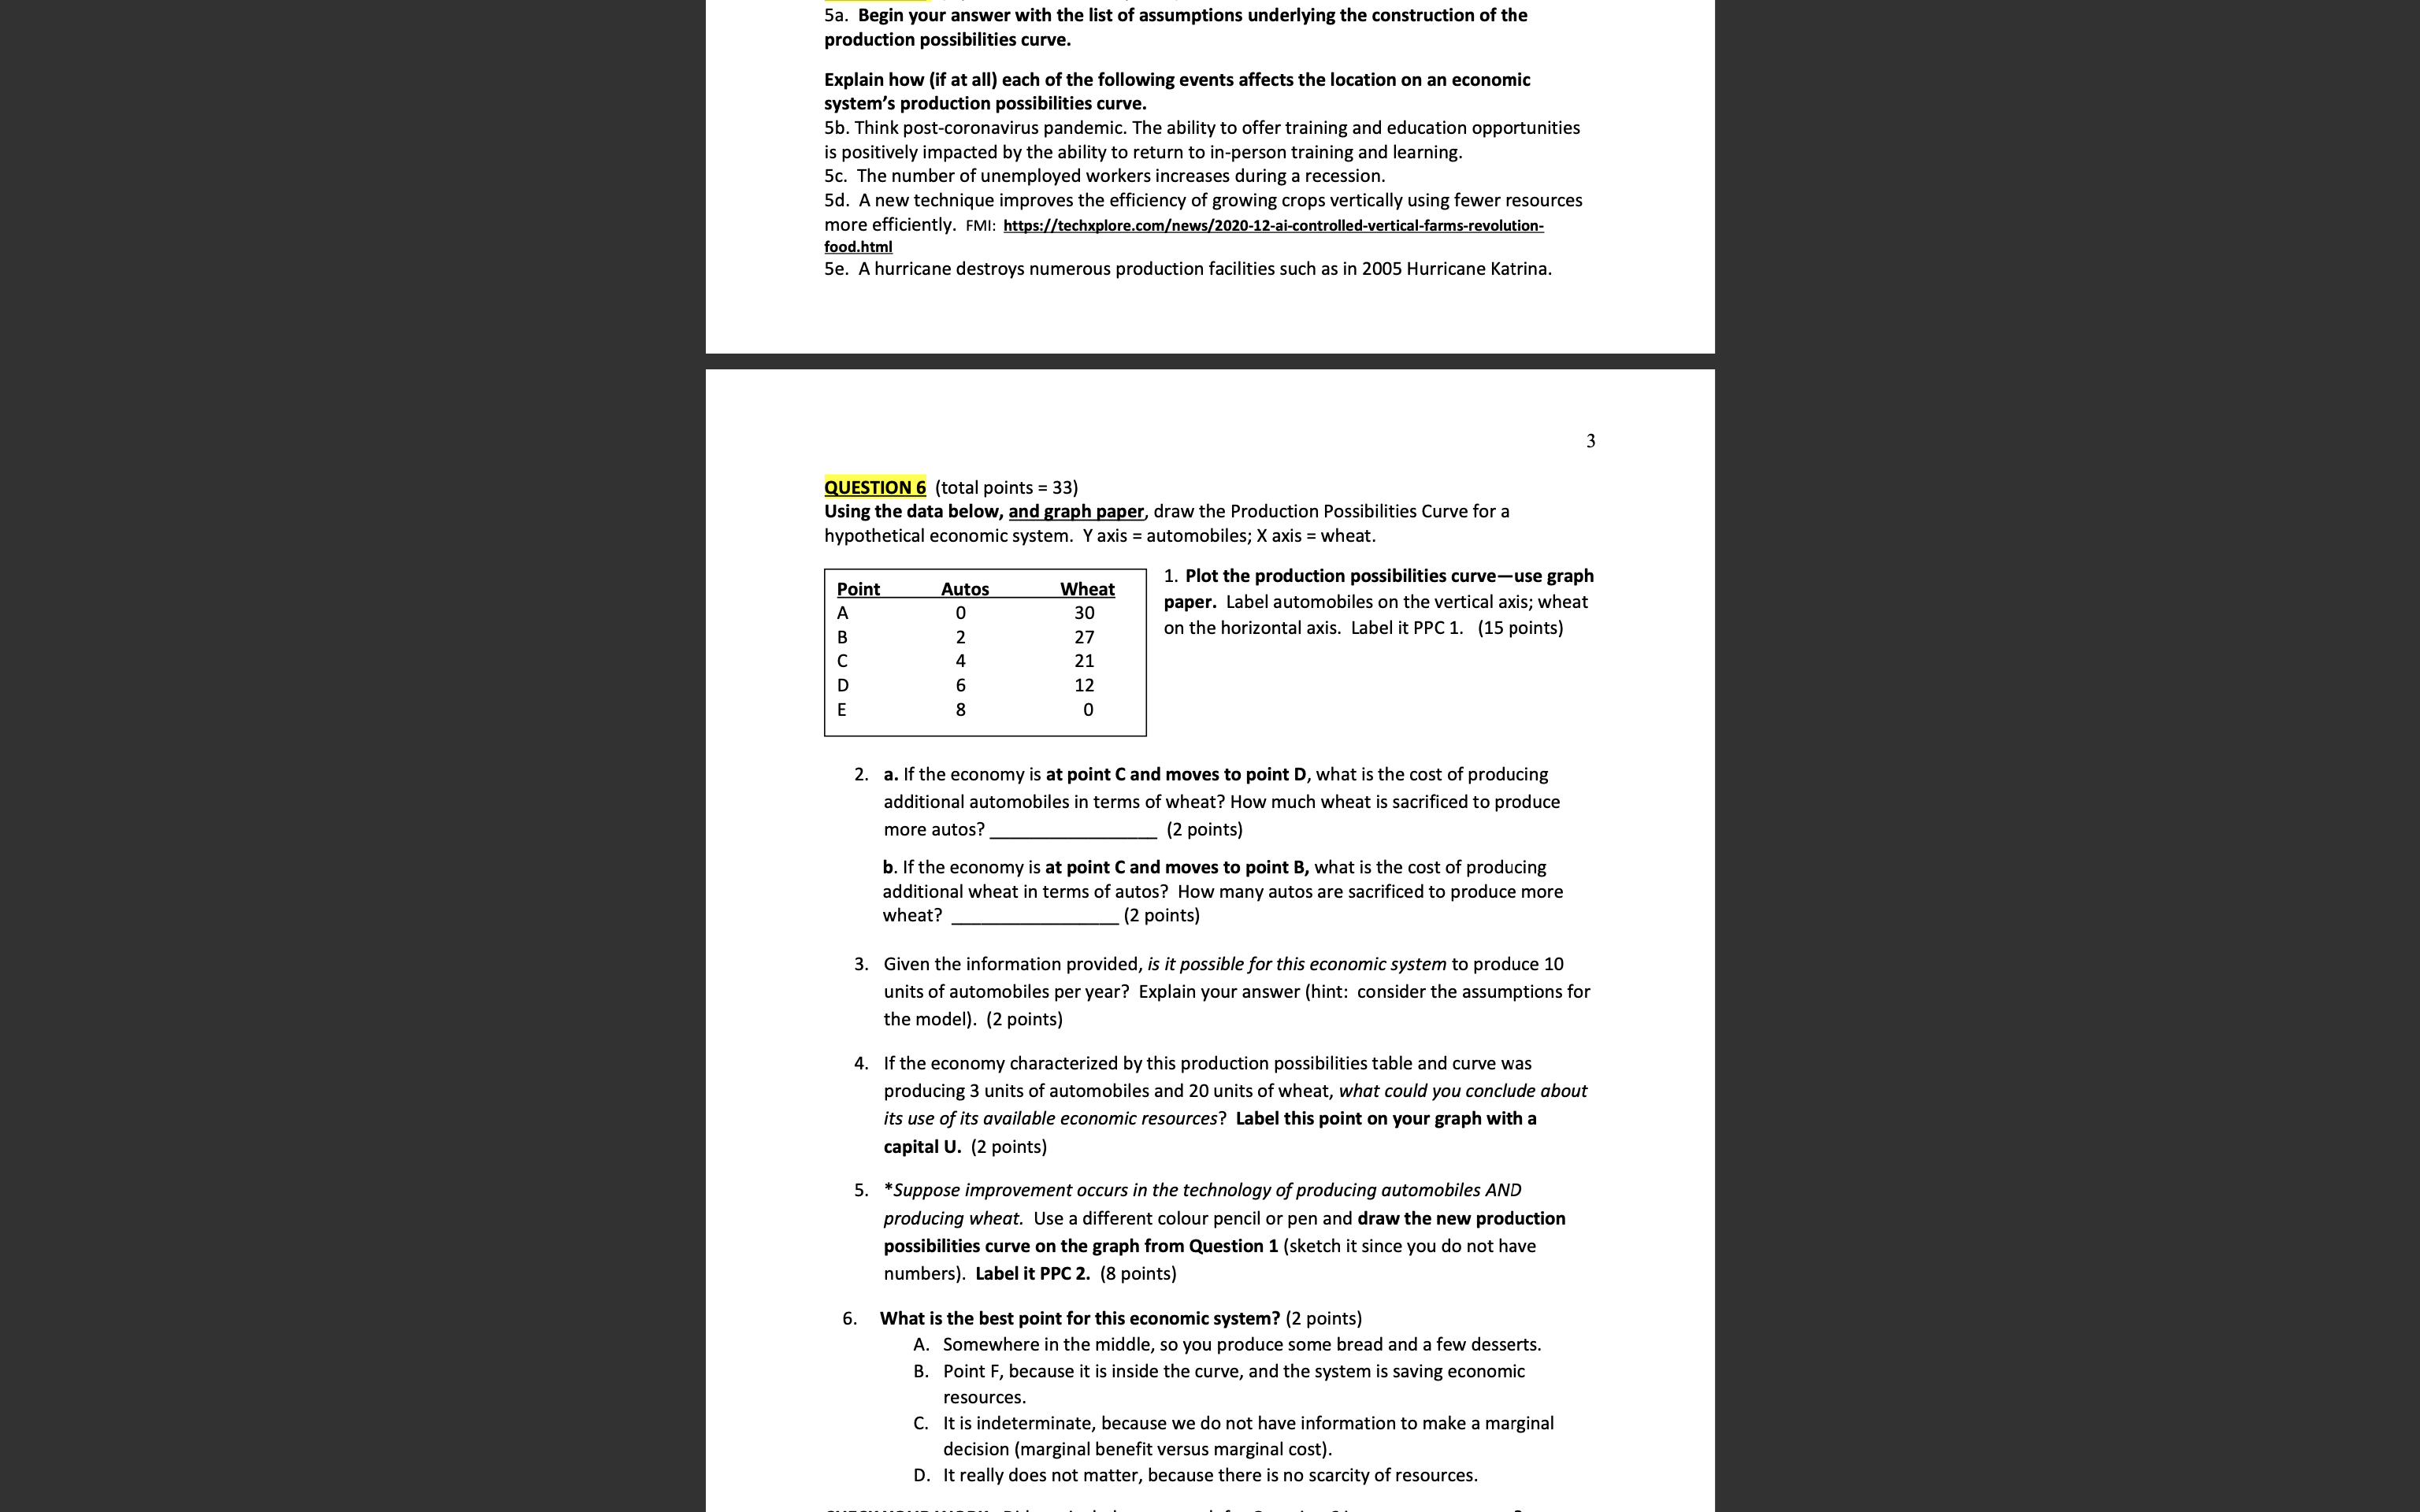
5a. Begin your answer with the list of assumptions underlying the construction of the production possibilities curve. Explain how (if at all) each of the following events affects the location on an economic system's production possibilities curve. 5b. Think post-coronavirus pandemic. The ability to offer training and education opportunities is positively impacted by the ability to return to in-person training and learning. 5c. The number of unemployed workers increases during a recession. 5d. A new technique improves the efficiency of growing crops vertically using fewer resources more efficiently. FMI: https://techxplore.comews/2020-12-ai-controlled-vertical-farms-revolution- food.html e. A hurricane destroys numerous production facilities such as in 2005 Hurricane Katrina. QUESTION 6 (total points = 33) Using the data below, and graph paper, draw the Production Possibilities Curve for a hypothetical economic system. Y axis = automobiles; X axis = wheat. Point . Plot the production possibilities curve-use graph Autos Wheat 30 paper. Label automobiles on the vertical axis; wheat A 0 B 27 on the horizontal axis. Label it PPC 1. (15 points) 00 On AN 2. a. If the economy is at point C and moves to point D, what is the cost of producing additional automobiles in terms of wheat? How much wheat is sacrificed to produce more autos? (2 points) b. If the economy is at point C and moves to point B, what is the cost of producing additional wheat in terms of autos? How many autos are sacrificed to produce more wheat? (2 points) 3. Given the information provided, is it possible for this economic system to produce 10 units of automobiles per year? Explain your answer (hint: consider the assumptions for the model). (2 points) 4. If the economy characterized by this production possibilities table and curve was producing 3 units of automobiles and 20 units of wheat, what could you conclude about its use of its available economic resources? Label this point on your graph with a capital U. (2 points) 5. *Suppose improvement occurs in the technology of producing automobiles AND producing wheat. Use a different colour pencil or pen and draw the new production possibilities curve on the graph from Question 1 (sketch it since you do not have numbers). Label it PPC 2. (8 points 6. What is the best point for this economic system? (2 points) A. Somewhere in the middle, so you produce some bread and a few desserts. B. Point F, because it is inside the curve, and the system is saving economic resources. C. It is indeterminate, because we do not have information to make a marginal decision (marginal benefit versus marginal cost). D. It really does not matter, because there is no scarcity of resources
Step by Step Solution
There are 3 Steps involved in it

Get step-by-step solutions from verified subject matter experts