

Question: Please help 7/31/2020 TEST-2 Ch. 10,5 Student: Date: Instructor: Igor Yatskar Course: STA2023 STATISTICS SD-2020 Assignment: TEST-2 Ch. 10,5 1. Find the value of the
Please help
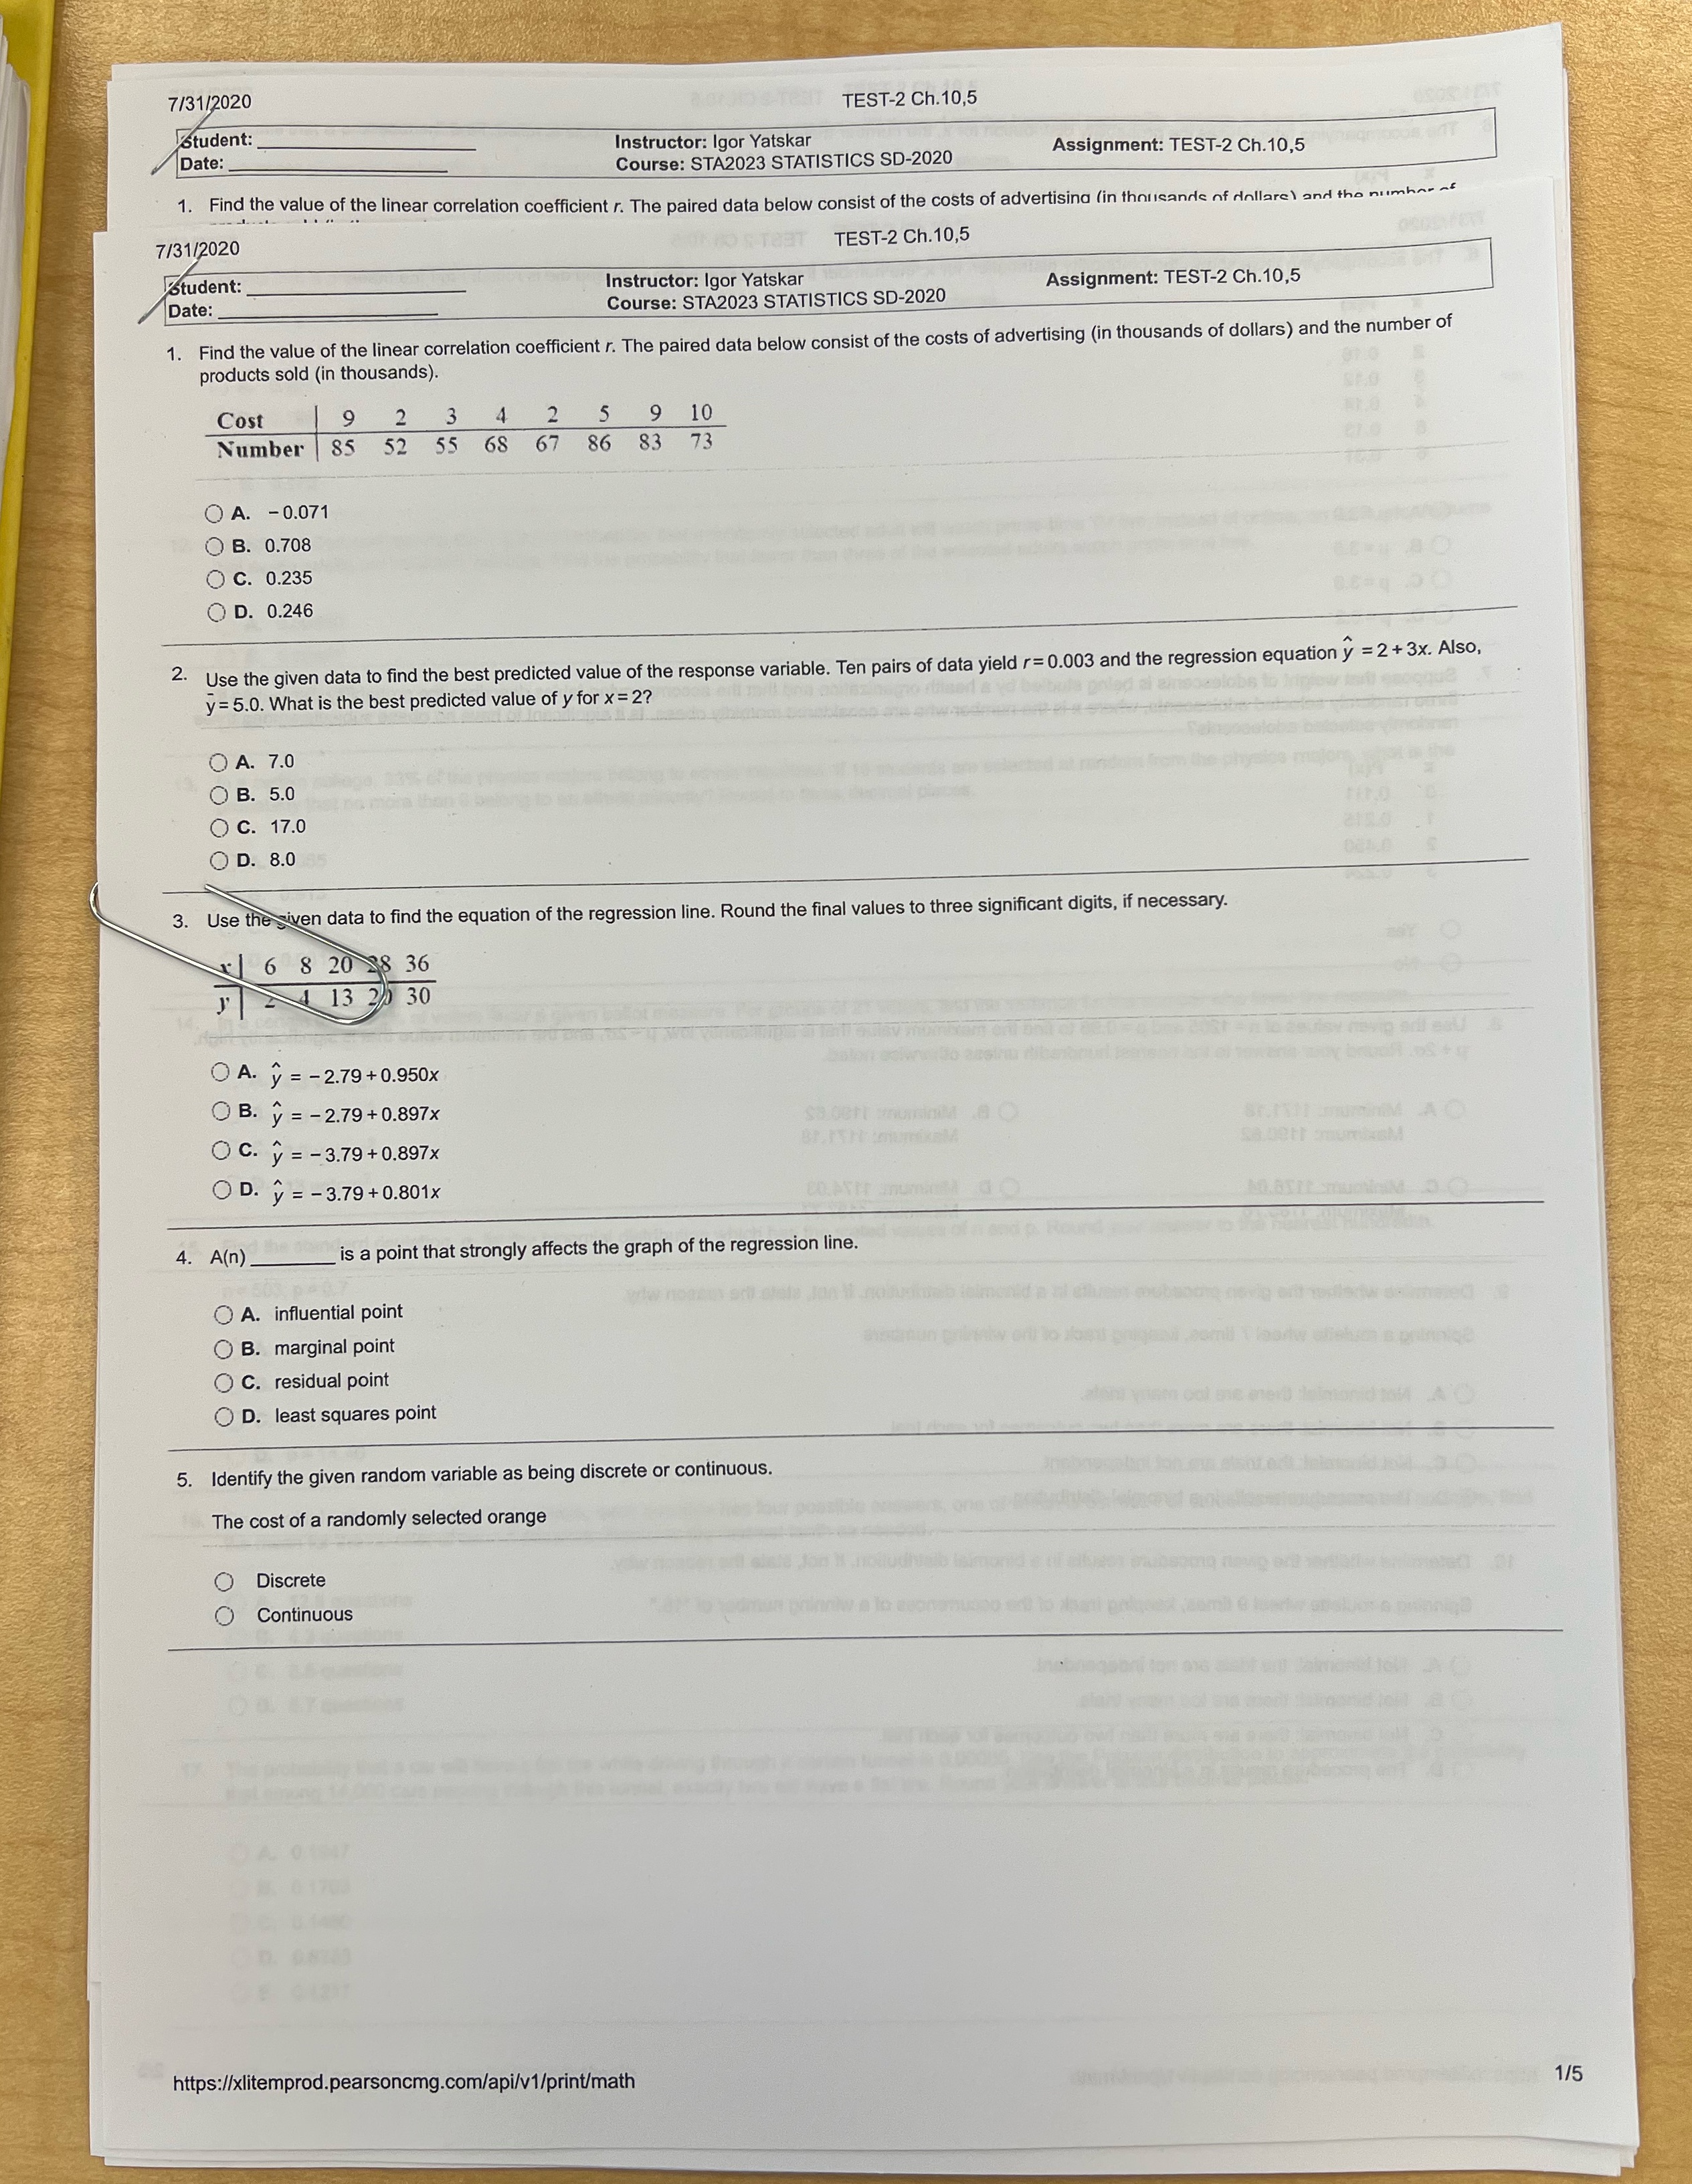
7/31/2020 TEST-2 Ch. 10,5 Student: Date: Instructor: Igor Yatskar Course: STA2023 STATISTICS SD-2020 Assignment: TEST-2 Ch. 10,5 1. Find the value of the linear correlation coefficient r. The paired data below consist of the costs of advertising (in thousands of inllare) and the number at 7/31/2020 TEST-2 Ch. 10,5 Student: Instructor: Igor Yatskar Date: Course: STA2023 STATISTICS SD-2020 Assignment: TEST-2 Ch.10,5 1. Find the value of the linear correlation coefficient r. The paired data below consist of the costs of advertising (in thousands of dollars) and the number of products sold (in thousands). Cost 9 2 3 2 9 10 Number 85 52 55 68 67 86 83 O A. - 0.071 O B. 0.708 O C. 0.235 O D. 0.246 2. Use the given data to find the best predicted value of the response variable. Ten pairs of data yield r= 0.003 and the regression equation y = 2+ 3x. Also, y= 5.0. What is the best predicted value of y for x = 2? O A. 7.0 O B. 5.0 O C. 17.0 O D. 8.0 3. Use the viven data to find the equation of the regression line. Round the final values to three significant digits, if necessary. x 6 8 20 38 36 J'13 25 30 O A. y = -2.79+ 0.950x OB. y = -2.79 +0.897x O C. y = -3.79+0.897x DD. y = -3.79 +0.801x 4. A(n)_ is a point that strongly affects the graph of the regression line. O A. influential point O B. marginal point O C. residual point OD. least squares point 5. Identify the given random variable as being discrete or continuous. The cost of a randomly selected orange Discrete Continuous 30 1708 https://xlitemprod.pearsoncmg.com/api/v1/print/math 1/5
Step by Step Solution
There are 3 Steps involved in it

Get step-by-step solutions from verified subject matter experts