

Question: Please help A study that looked at beverage consumption used sample sizes that were much smaller than previous national surveys. One part of this study
Please help
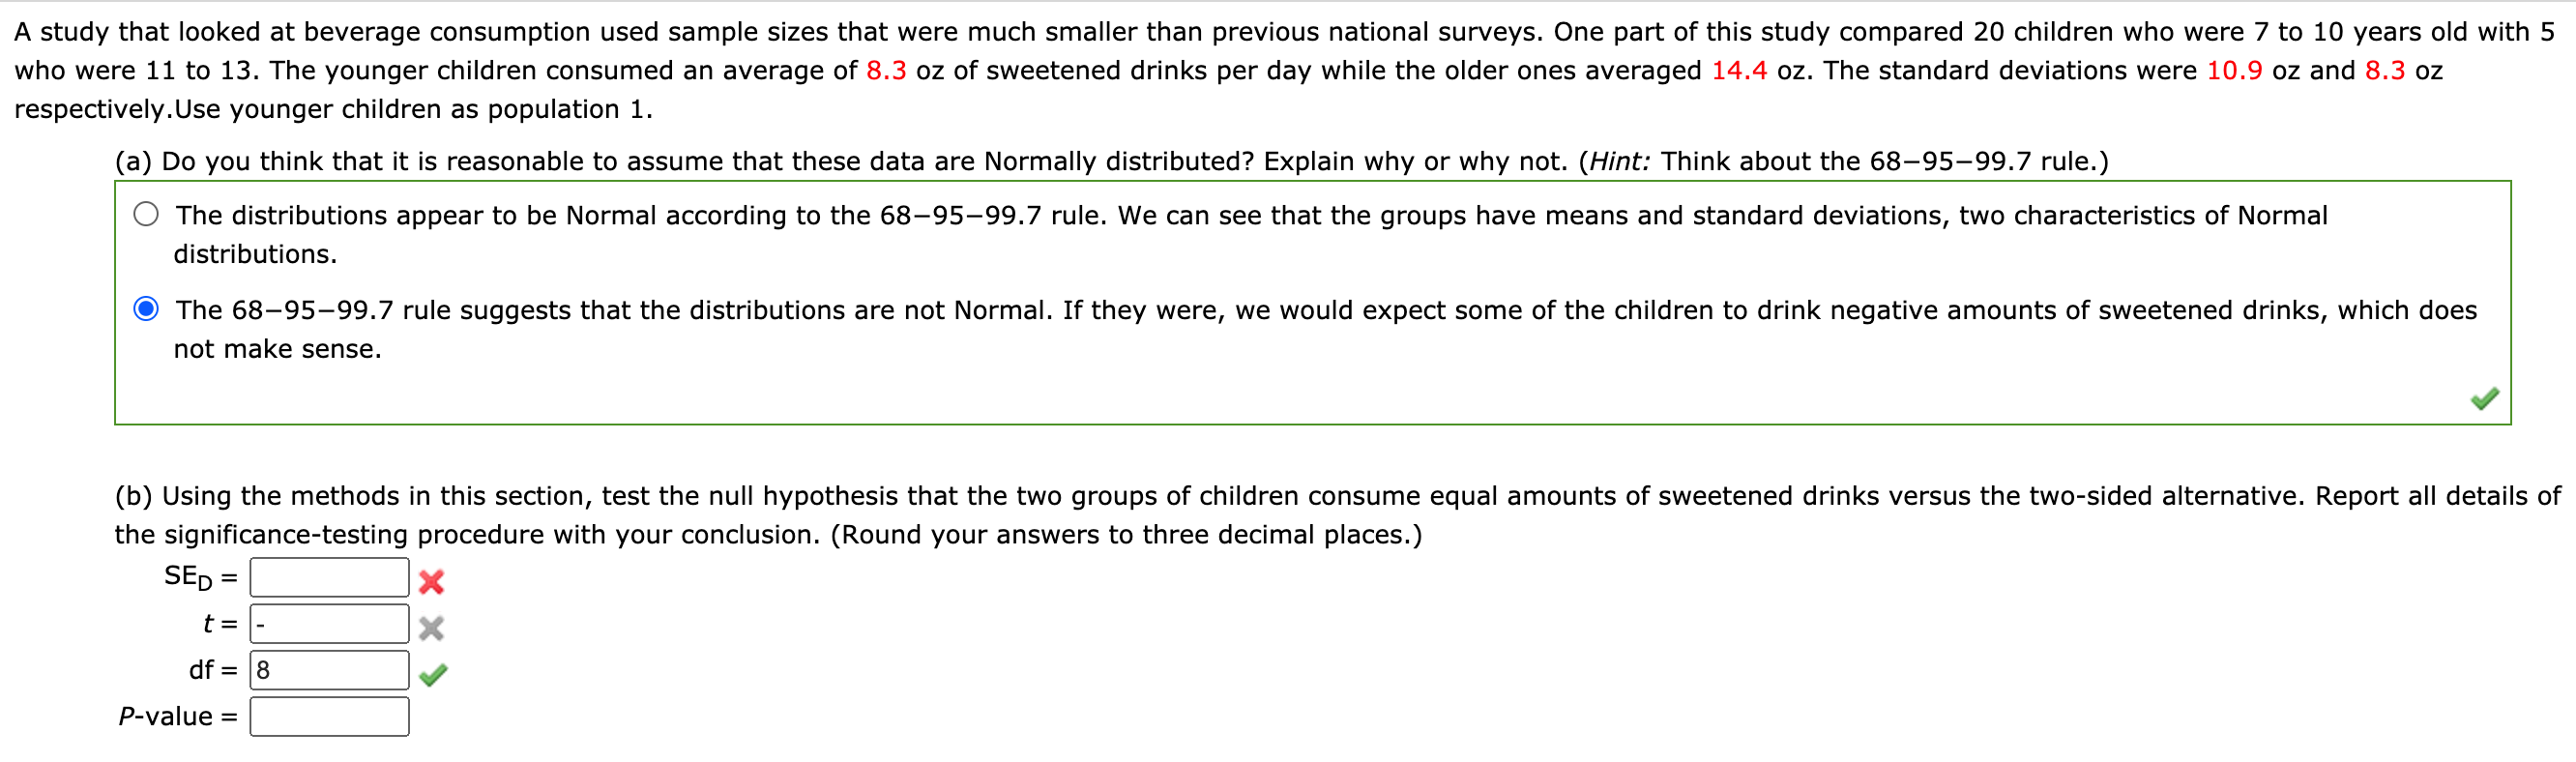
A study that looked at beverage consumption used sample sizes that were much smaller than previous national surveys. One part of this study compared 20 children who were 7 to 10 years old with 5 who were 11 to 13. The younger children consumed an average of 8.3 oz of sweetened drinks per day while the older ones averaged 14.4 oz. The standard deviations were 10.9 oz and 8.3 oz respectively.Use younger children as population 1. (a) Do you think that it is reasonable to assume that these data are Normally distributed? Explain why or why not. (Hint: Think about the 689599] rule.) O The distributions appear to be Normal according to the 689599] rule. We can see that the groups have means and standard deviations, two characteristics of Normal distributions. The 689599.7 rule suggests that the distributions are not Normal. If they were, we would expect some of the children to drink negative amounts of sweetened drinks, which does not make sense. q! (b) Using the methods in this section, test the null hypothesis that the two groups of children consume equal amounts of sweetened drinks versus the two-sided alternative. Report all details of the signicance-testing procedure with your conclusion. (Round your answers to three decimal places.) SED = x t: ' X df= 8 y P-value =
Step by Step Solution
There are 3 Steps involved in it

Get step-by-step solutions from verified subject matter experts