

Question: please help An engineer wanted to determine how the weight of a car affects gas mileage. The accompanying data represent the weights of various domestic
please help
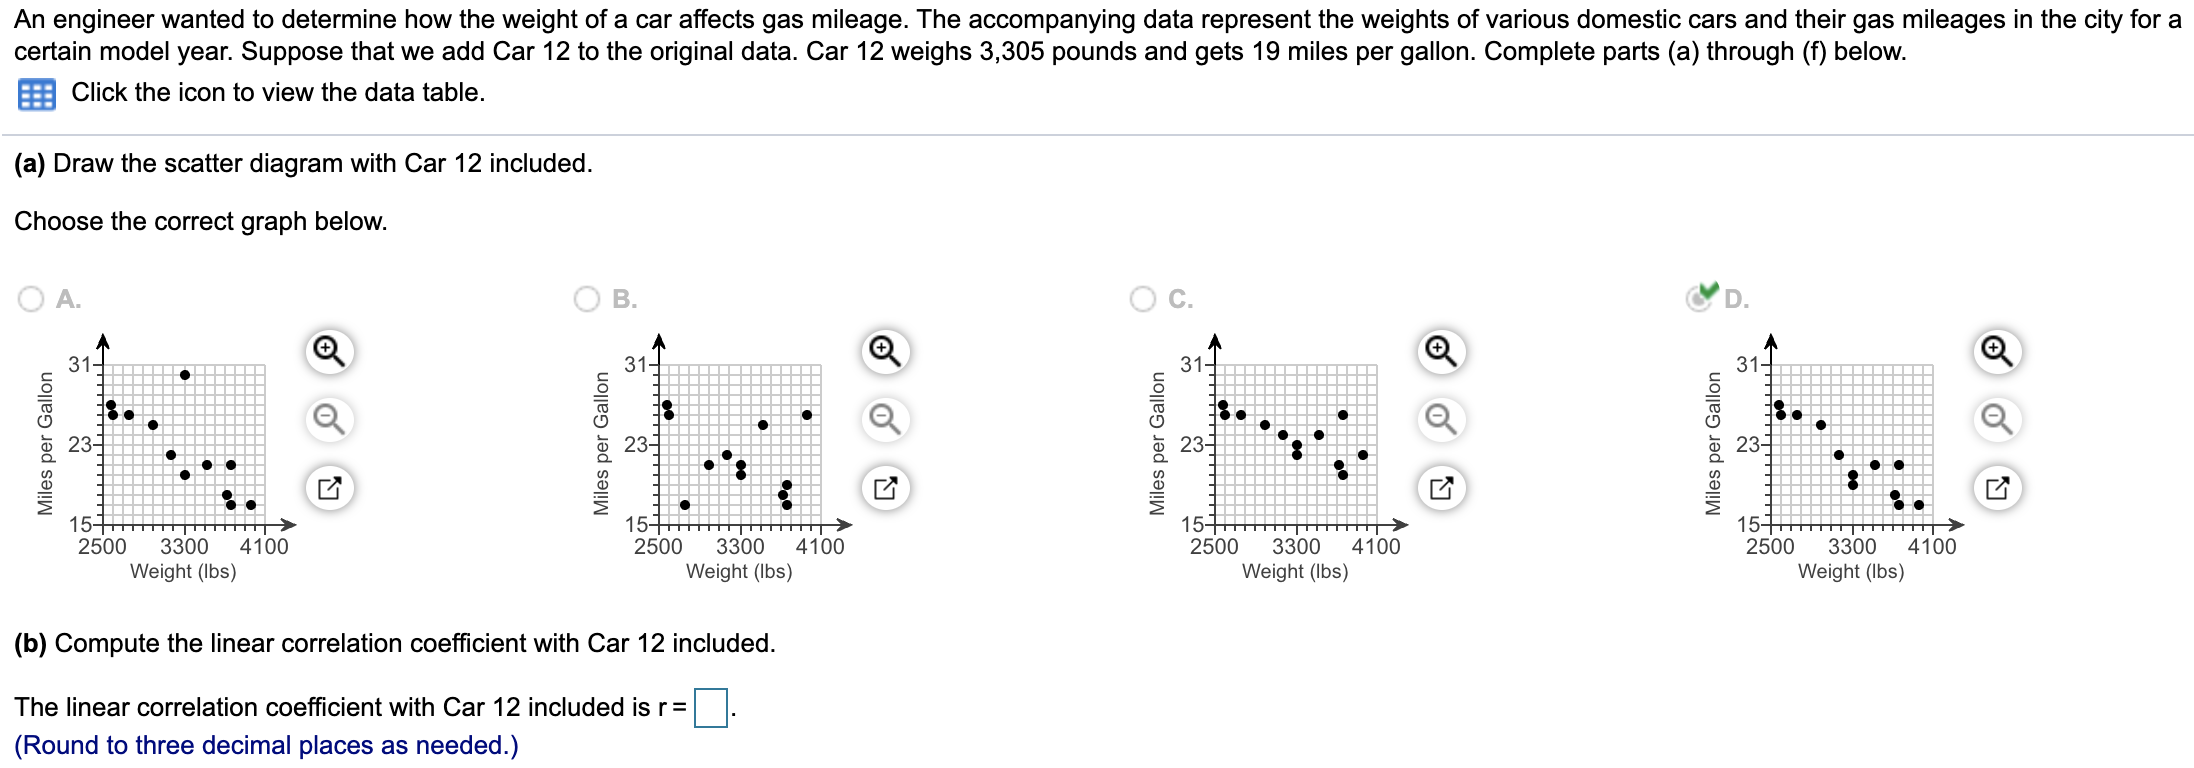
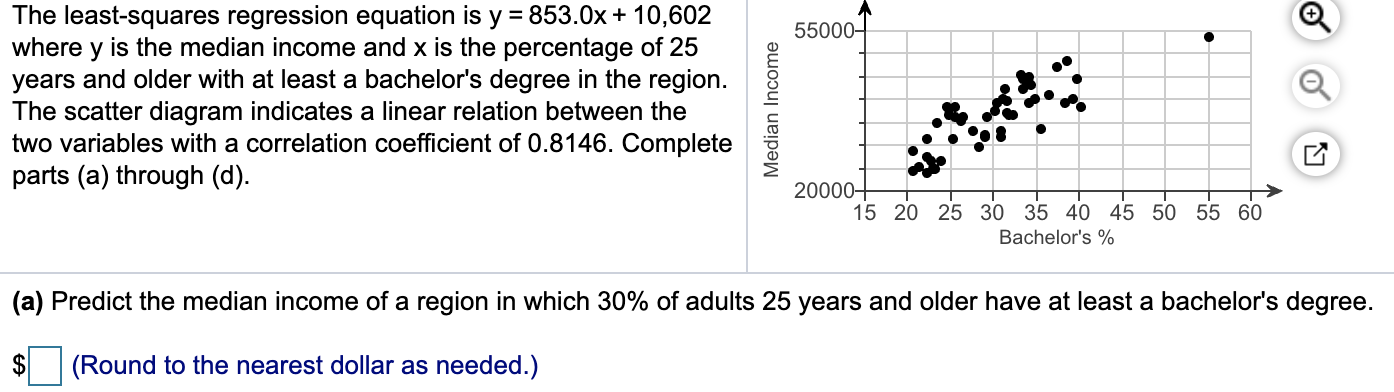
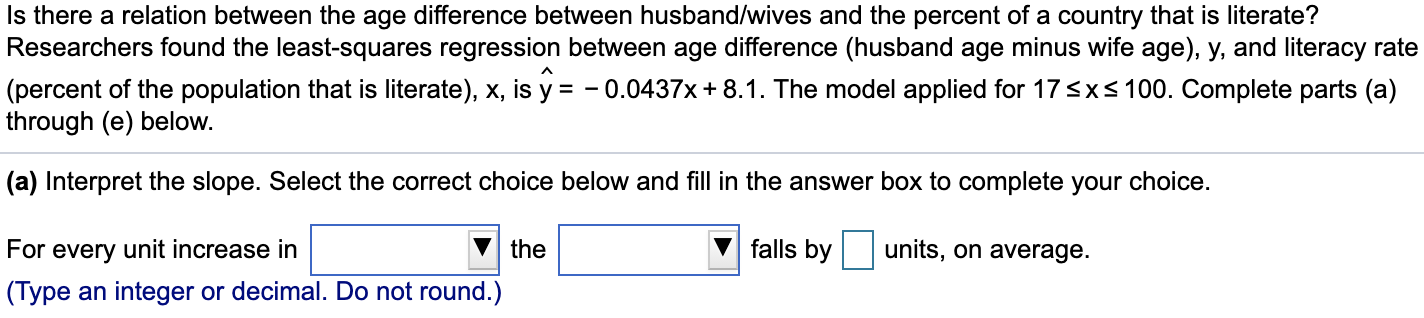
An engineer wanted to determine how the weight of a car affects gas mileage. The accompanying data represent the weights of various domestic cars and their gas mileages in the city for a certain model year. Suppose that we add Car 12 to the original data. Car 12 weighs 3,305 pounds and gets 19 miles per gallon. Complete parts (a) through (f) below. a Click the icon to view the data table. (a) Draw the scatter diagram with Car 12 included. Choose the correct graph below. A. B. c. .V D. E E 31 E 31 E 2 _ 2 2 E E E E (D (D (D (D 2 2 23 i; 23 2 3 :3 E :3 15 15 2500 3300 4100 2500 3300 4100 2500 3300 4100 2500 3300 4100 Weight (lbs) Weight (lbs) Weight (lbs) Weight (lbs) (b) Compute the linear correlation coefcient with Car 12 included. The linear correlation coefcient with Car 12 included is r = (Round to three decimal places as needed.) The least-squares regression equation is y = 853.0x + 10,602 where y is the median income and x is the percentage of 25 years and older with at least a bachelor's degree in the region. The scatter diagram indicates a linear relation between the two variables with a correlation coefcient of 0.8146. Complete parts (a) through (d). Median Income 15 20 25 3O 35 40 45 50 55 60 Bachelor's% (a) Predict the median income of a region in which 30% of adults 25 years and older have at least a bachelor's degree. $|:| (Round to the nearest dollar as needed.) Is there a relation between the age difference between husbandlwives and the percent of a country that is literate? Researchers found the least-squares regression between age difference (husband age minus wife age), y, and literacy rate (percent of the population that is literate), x, is 9 = - 0.0437x + 8.1. The model applied for 17 5x5 100. Complete parts (a) through (e) below. (a) Interpret the slope. Select the correct choice below and ll in the answer box to complete your choice. For every unit increase in |:l the |:l falls by D units, on average. (Type an integer or decimal. Do not round.)
Step by Step Solution
There are 3 Steps involved in it

Get step-by-step solutions from verified subject matter experts