

Question: Please help and explain with #2 (a-c)! Thank you! 2. Lexi is interested in the relationship between test scores and number of hours of sleep.
Please help and explain with #2 (a-c)! Thank you!
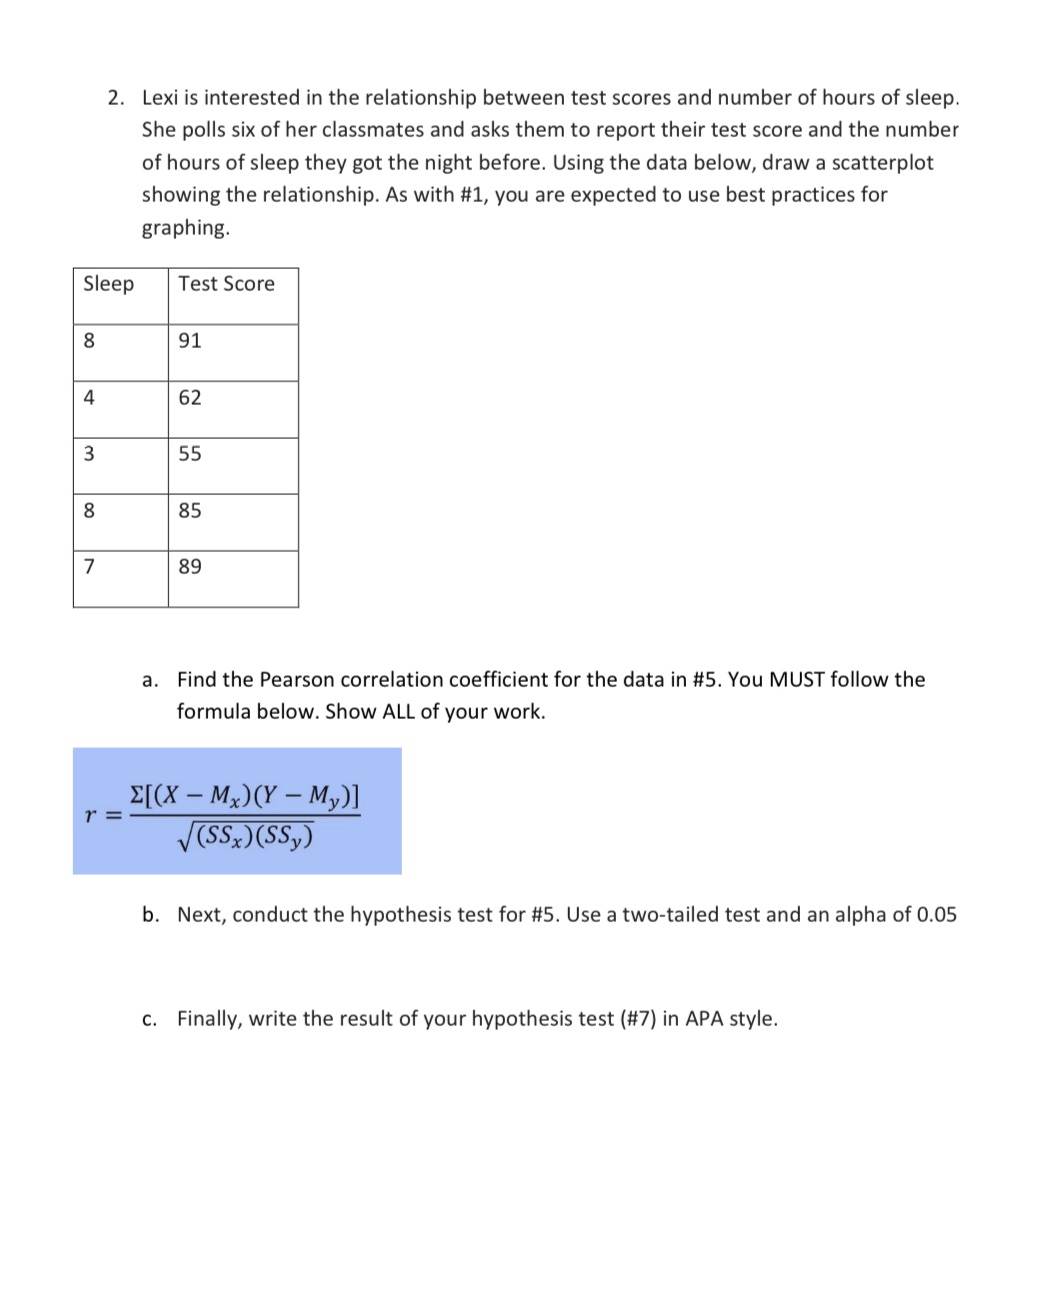
2. Lexi is interested in the relationship between test scores and number of hours of sleep. She polls six of her classmates and asks them to report their test score and the number of hours of sleep they got the night before. Using the data below, draw a scatterplot showing the relationship. As with #1, you are expected to use best practices for graphing. Test Score 91 62 55 85 89 a. Find the Pearson correlation coefcient for the data in #5. You MUST follow the formula below. Show ALL of your work. b. Next, conduct the hypothesis test for #5. Use a two-tailed test and an alpha of 0.05 c. Finally, write the result of your hypothesis test (#7) in APA style
Step by Step Solution
There are 3 Steps involved in it

Get step-by-step solutions from verified subject matter experts