

Question: PLEASE HELP AND PLEASE SHOW STEPS SO THAT I CAN UNDERSTAND. 2. Relationship Between Two Categorical Variables Choose two categorical variables: State the type of
PLEASE HELP AND PLEASE SHOW STEPS SO THAT I CAN UNDERSTAND.
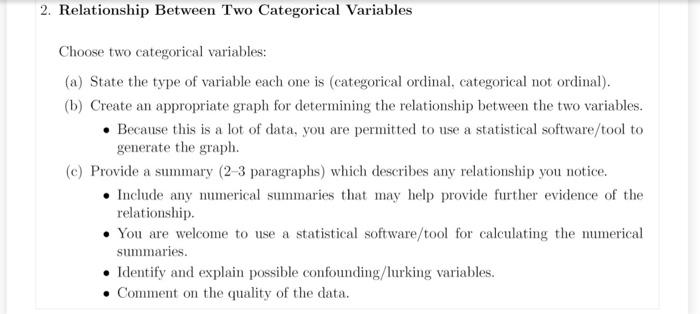
2. Relationship Between Two Categorical Variables Choose two categorical variables:
- State the type of variable each one is (categorical ordinal, categorical not ordinal).
- Create an appropriate graph for determining the relationship between the two variables.
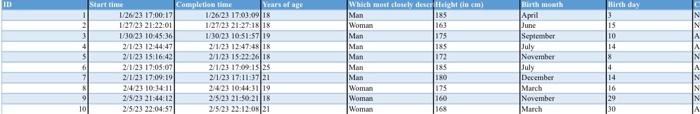
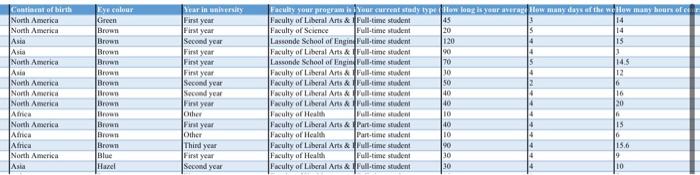
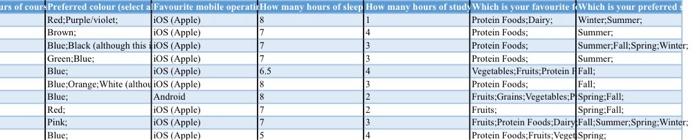
Because this is a lot of data, you are permitted to use a statistical software/tool to generate the graph.
(c) Provide a summary (2-3 paragraphs) which describes any relationship you notice.
- Include any numerical summaries that may help provide further evidence of the relationship.
- You are welcome to use a statistical software/tool for calculating the numerical summaries.
- Identify and explain possible confounding /lurking variables.
- Comment on the quality of the data.
2. Relationship Between Two Categorical Variables Choose two categorical variables: (a) State the type of variable each one is (categorical ordinal, categorical not ordinal). (b) Create an appropriate graph for determining the relationship between the two variables. - Because this is a lot of data, you are permitted to use a statistical software/tool to generate the graph. (c) Provide a summary (2-3 paragraphs) which describes any relationship you notice. - Include any numerical summaries that may help provide further evidence of the relationship. - You are welcome to use a statistical software/tool for calculating the numerical summaries. - Identify and explain possible confounding/lurking variables. - Comment on the quality of the data. 2. Relationship Between Two Categorical Variables Choose two categorical variables: (a) State the type of variable each one is (categorical ordinal, categorical not ordinal). (b) Create an appropriate graph for determining the relationship between the two variables. - Because this is a lot of data, you are permitted to use a statistical software/tool to generate the graph. (c) Provide a summary (2-3 paragraphs) which describes any relationship you notice. - Include any numerical summaries that may help provide further evidence of the relationship. - You are welcome to use a statistical software/tool for calculating the numerical summaries. - Identify and explain possible confounding/lurking variables. - Comment on the quality of the data
Step by Step Solution
There are 3 Steps involved in it

Get step-by-step solutions from verified subject matter experts