

Question: The Pearson residuals in the Goodness-of-Fit problems = (Observed - Expected) 2 /Expected) .The expected matrix can be found in matrix [B] after you run
The Pearson residuals in the Goodness-of-Fit problems = (Observed - Expected)2/Expected) .The expected matrix can be found in matrix [B] after you run the chi-squared test, and the residuals are the (Observed - Expected)2/Expected.
Label the screenshots
![expected matrix can be found in matrix [B] after you run the](https://dsd5zvtm8ll6.cloudfront.net/si.experts.images/questions/2024/11/672f088848982_624672f08883a563.jpg)
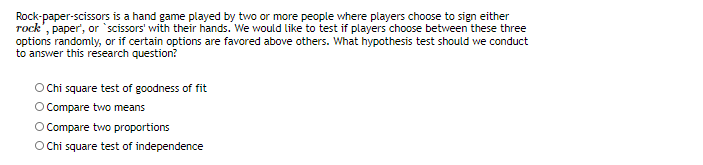
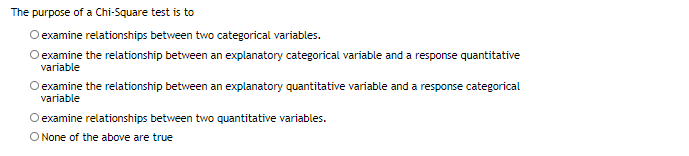
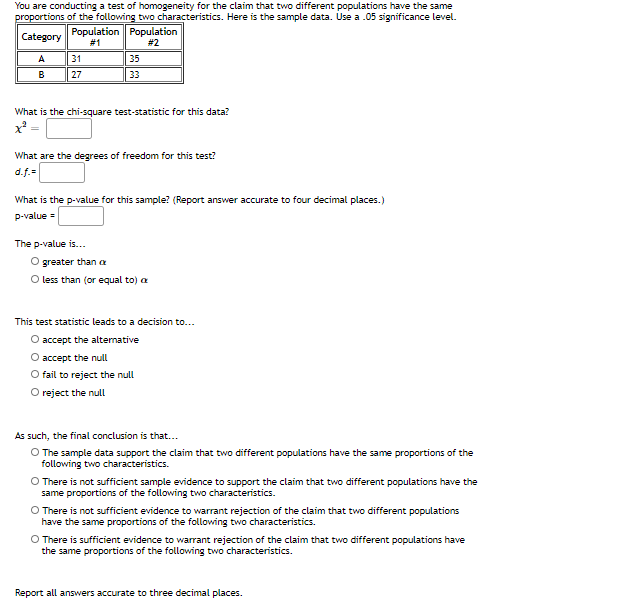
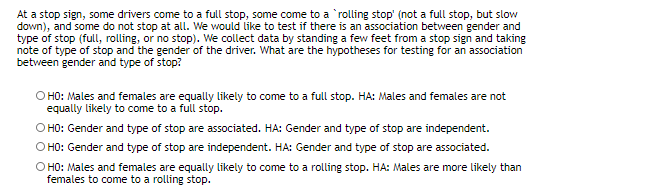
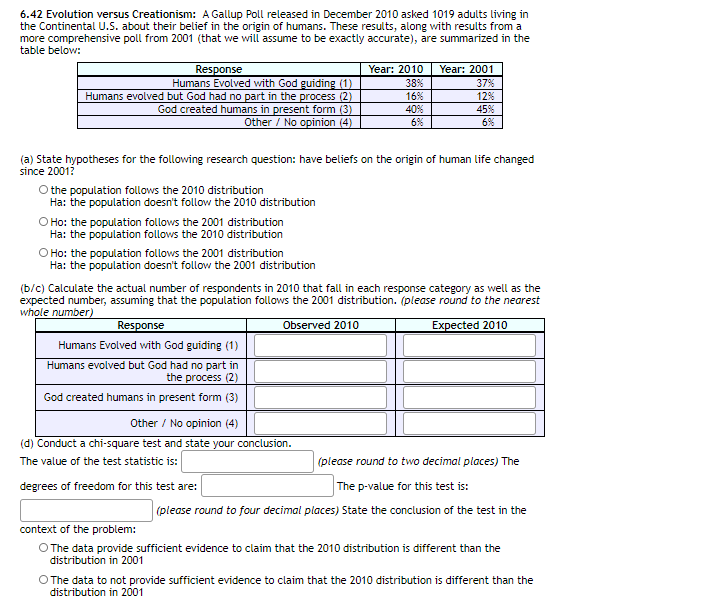
6.42 Evolution versus Creationism: A Gallup Poll released in December 2010 asked 1019 adults living in the Continental U.S. about their belief in the origin of humans. These results, along with results from a more comprehensive poll from 2001 (that we will assume to be exactly accurate), are summarized in the table below: Response Year: 2010 | Year: 2001 Humans Evolved with God guiding (1) 38% 37% Humans evolved but God had no part in the process (2) 16% 12% God created humans in present form (3) 40% 45% Other / No opinion (4) 6% 6% (a) State hypotheses for the following research question: have beliefs on the origin of human life changed since 2001? the population follows the 2010 distribution Ha: the population doesn't follow the 2010 distribution O Ho: the population follows the 2001 distribution Ha: the population follows the 2010 distribution O Ho: the population follows the 2001 distribution Ha: the population doesn't follow the 2001 distribution (b/c) Calculate the actual number of respondents in 2010 that fall in each response category as well as the expected number, assuming that the population follows the 2001 distribution. (please round to the nearest whole number Response Observed 2010 Expected 2010 Humans Evolved with God guiding (1) Humans evolved but God had no part in the process (2) God created humans in present form (3) Other / No opinion (4) (d) Conduct a chi-square test and state your conclusion. The value of the test statistic is: (please round to two decimal places) The degrees of freedom for this test are: The p-value for this test is: (please round to four decimal places) State the conclusion of the test in the context of the problem: The data provide sufficient evidence to claim that the 2010 distribution is different than the distribution in 2001 O The data to not provide sufficient evidence to claim that the 2010 distribution is different than the distribution in 20016.43 Rock-paper-scissors: Rock-paper-scissors is a hand game played by two or more people where players choose to sign either rock, paper, or scissors with their hands. For your AP Statistics class project, you want to evaluate whether players choose between these three options randomly, or if certain options are favored above others. You ask two friends to play rock-paper-scissors and count the times each option is played. The following table summarizes the data: Rock Paper Scissors 43 21 35 Use these data to evaluate whether players choose between these three options randomly, or if certain options are favored above others. Make sure to clearly outline each step of your analysis, and interpret your results in context of the data and the research question. The hypotheses to test the research question are: O Ho: people choose rock twice as much as paper Ha: paper is the best choice OHO: Prock = -43, Ppaper = .21, Pscissors = .35 Ha: at least one of the probabilities is different O Ho: the distribution is uniform Ha: this distribution is not uniform The value of the test statistic is: (please round to two decimal places) The degrees of freedom associated with this test are: The p-value associated with this test is: (please round to four decimal places) Discuss the conclusion of the test in the context of the research study: O The data do not provide sufficient evidence to claim that rock, paper, and scissors are not chosen equally as often as one another O The data provide sufficient evidence to claim that rock, paper, and scissors are not chosen equally as often as one anotherRock-paper-scissors is a hand game played by two or more people where players choose to sign either rock , paper', or scissors' with their hands. We would like to test if players choose between these three options randomly, or if certain options are favored above others. What hypothesis test should we conduct to answer this research question? O Chi square test of goodness of fit O Compare two means O Compare two proportions O Chi square test of independenceThe purpose of a Chi-Square test is to O examine relationships between two categorical variables. O examine the relationship between an explanatory categorical variable and a response quantitative variable O examine the relationship between an explanatory quantitative variable and a response categorical variable O examine relationships between two quantitative variables. O None of the above are trueYou are conducting a test of homogeneity for the claim that two different populations have the same proportions of the following two characteristics. Here is the sample data. Use a .05 significance level. Category Population |Population #1 #2 A 31 35 27 33 What is the chi-square test-statistic for this data? What are the degrees of freedom for this test? d.f.= What is the p-value for this sample? (Report answer accurate to four decimal places.) p-value = The p-value is... greater than a O less than (or equal to) a This test statistic leads to a decision to... accept the alternative O accept the null O fail to reject the null O reject the null As such, the final conclusion is that... The sample data support the claim that two different populations have the same proportions of the following two characteristics. O There is not sufficient sample evidence to support the claim that two different populations have the same proportions of the following two characteristics. There is not sufficient evidence to warrant rejection of the claim that two different populations have the same proportions of the following two characteristics. O There is sufficient evidence to warrant rejection of the claim that two different populations have the same proportions of the following two characteristics. Report all answers accurate to three decimal places.At a stop sign, some drivers come to a full stop, some come to a *rolling stop' (not a full stop, but slow down), and some do not stop at all. We would like to test if there is an association between gender and type of stop (full, rolling, or no stop). We collect data by standing a few feet from a stop sign and taking note of type of stop and the gender of the driver. What are the hypotheses for testing for an association between gender and type of stop? OHO: Males and females are equally likely to come to a full stop. HA: Males and females are not equally likely to come to a full stop. OHO: Gender and type of stop are associated. HA: Gender and type of stop are independent. O HO: Gender and type of stop are independent. HA: Gender and type of stop are associated. O HO: Males and females are equally likely to come to a rolling stop. HA: Males are more likely than females to come to a rolling stop
Step by Step Solution
There are 3 Steps involved in it

Get step-by-step solutions from verified subject matter experts