

Question: Please help and show work please! CENGAGE MINDTAP End-of-Chapter Problems: Chapter 08 Introduction to Hypothesis Testing Researchers at a weather center in the northeastern United
Please help and show work please!
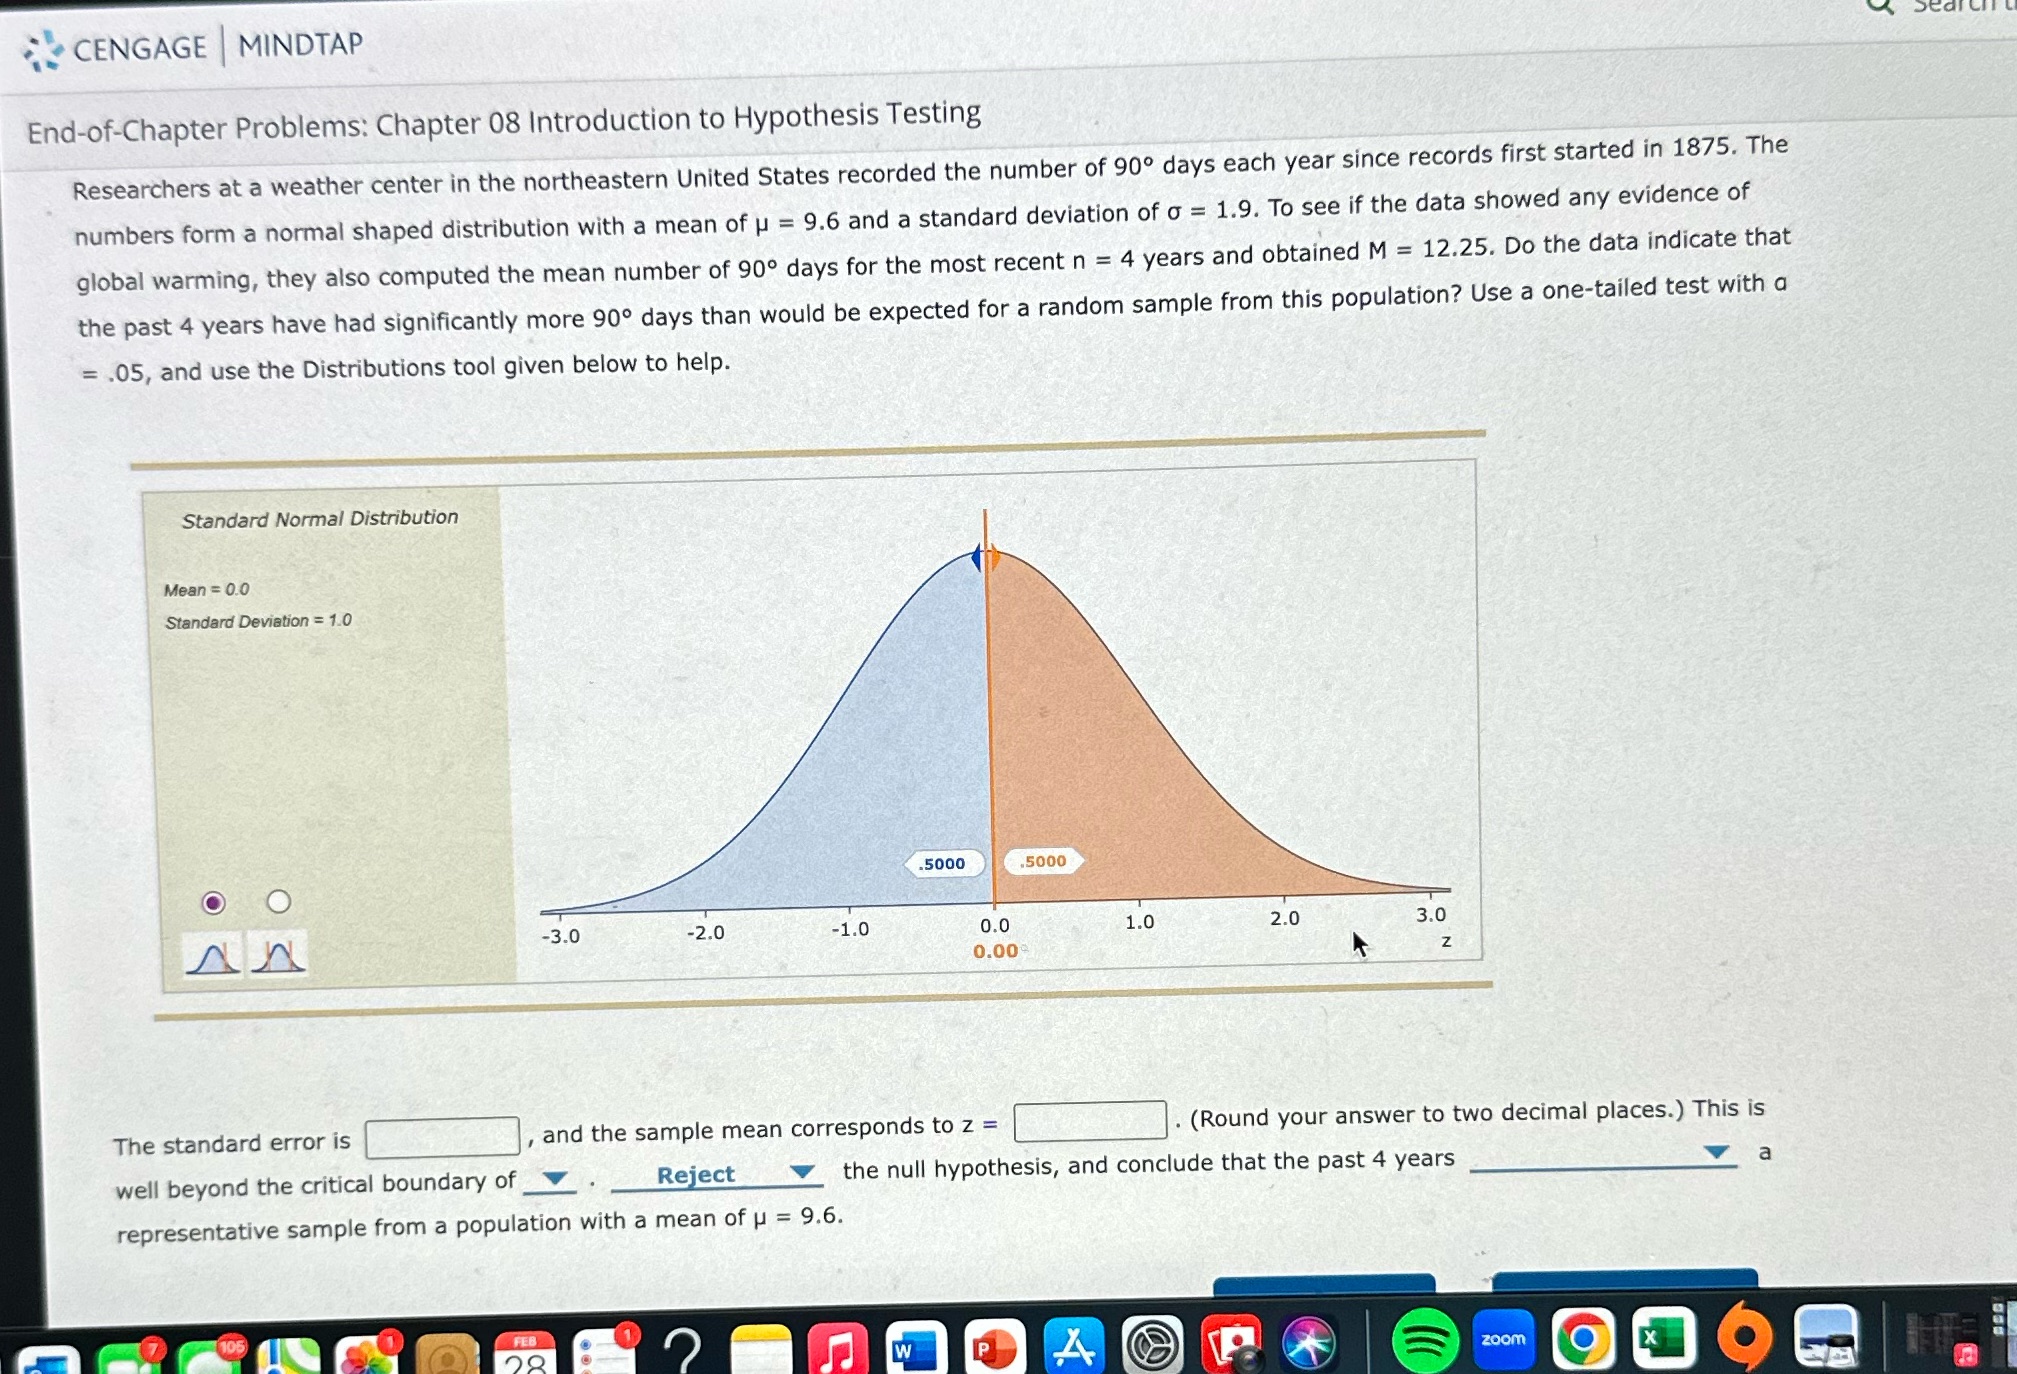
CENGAGE MINDTAP End-of-Chapter Problems: Chapter 08 Introduction to Hypothesis Testing Researchers at a weather center in the northeastern United States recorded the number of 90 days each year since records first started in 1875. The numbers form a normal shaped distribution with a mean of u = 9.6 and a standard deviation of o = 1.9. To see if the data showed any evidence of global warming, they also computed the mean number of 90 days for the most recent n = 4 years and obtained M = 12.25. Do the data indicate that the past 4 years have had significantly more 90 days than would be expected for a random sample from this population? Use a one-tailed test with a = .05, and use the Distributions tool given below to help. Standard Normal Distribution Mean = 0.0 Standard Deviation = 1.0 5000 .5000 O O -3.0 -2.0 -1.0 0.0 1.0 2.0 3.0 0.00 The standard error is , and the sample mean corresponds to z = . (Round your answer to two decimal places.) This is well beyond the critical boundary of Reject the null hypothesis, and conclude that the past 4 years a representative sample from a population with a mean of u = 9.6. 7 105 FEB 4 zoom
Step by Step Solution
There are 3 Steps involved in it

Get step-by-step solutions from verified subject matter experts