

Question: Please help answer a - e on the attached. CHAPTER 4 Profitability Analysis REQUIRED a. Walmart and Target follow somewhat different strategies. Using information in
Please help answer a - e on the attached.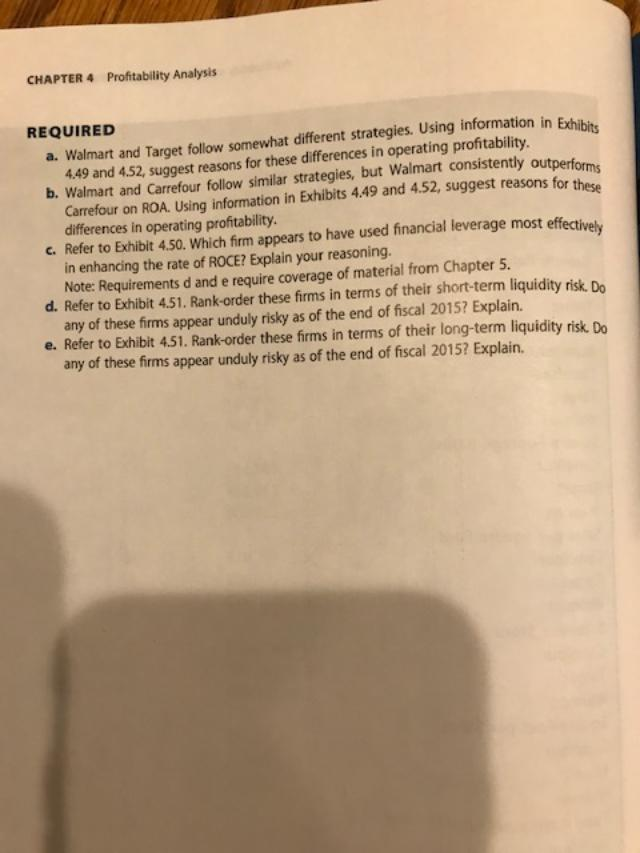
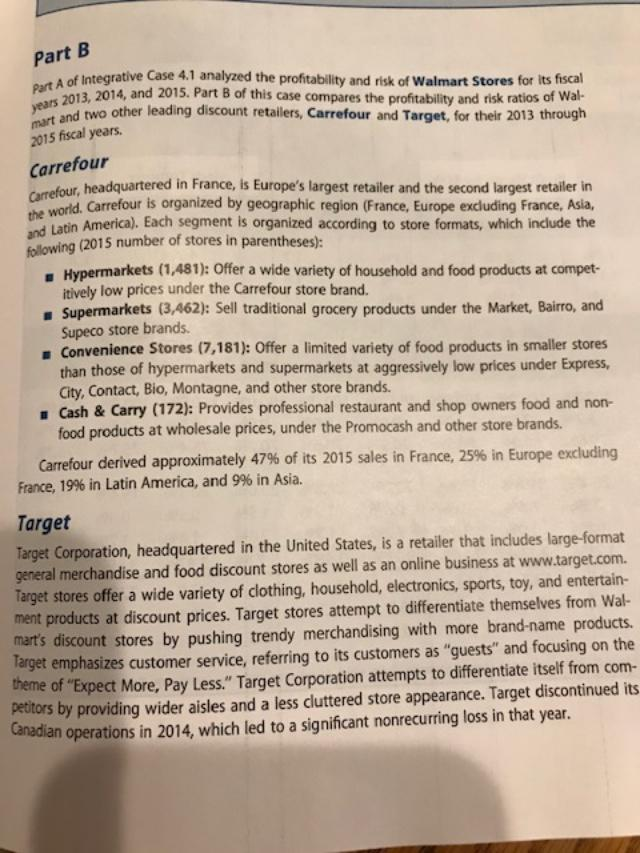
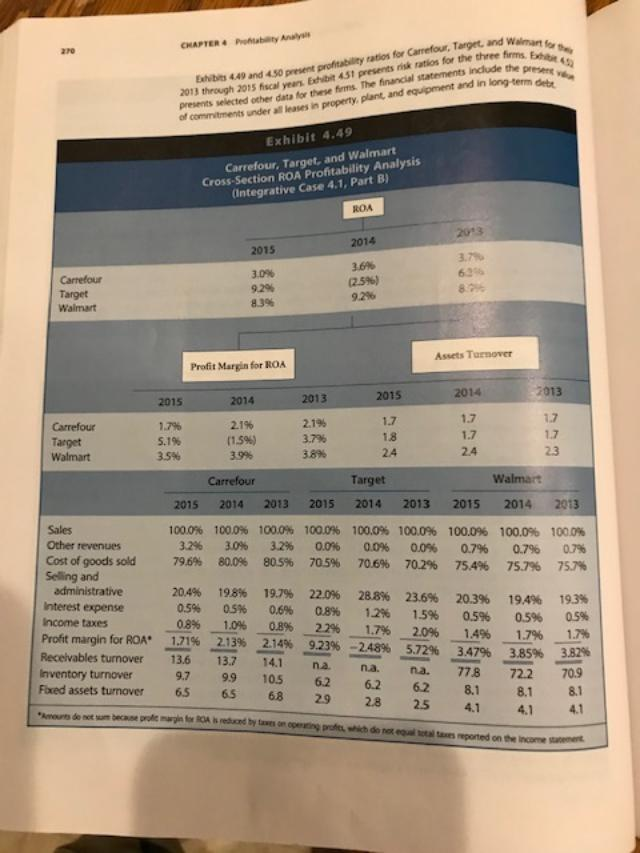
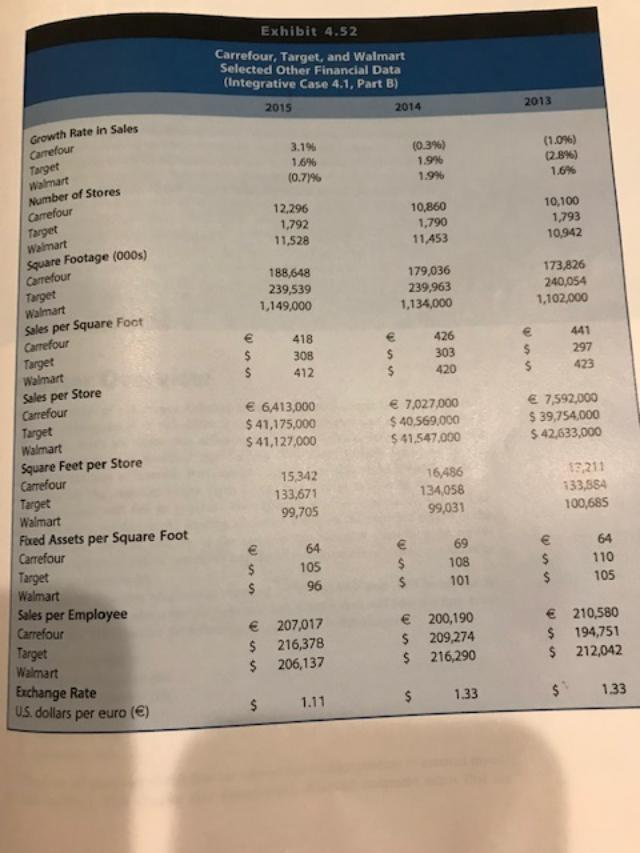
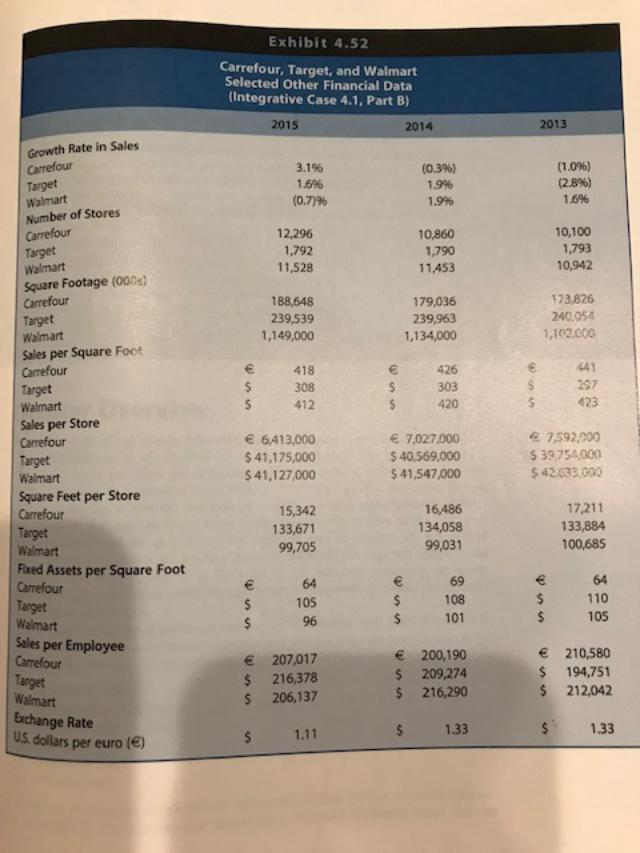
CHAPTER 4 Profitability Analysis REQUIRED a. Walmart and Target follow somewhat different strategies. Using information in Exhi 4.49 and 4.52, suggest reasons for these differences in operating profitability. b. Walmart and Carrefour follow similar strategies, but Walmart consistently outperfor Carrefour on ROA. Using information in Exhibits 4.49 and 4.52, suggest reasons for the differences in operating profitability. c. Refer to Exhibit 4.50. Which firm appears to have used financial leverage most effectively in enhancing the rate of ROCE? Explain your reasoning. Note: Requirements d and e require coverage of material from Chapter 5. d. Refer to Exhibit 4.51. Rank-order these firms in terms of their short-term liquidity risk. Do any of these firms appear unduly risky as of the end of fiscal 2015? Explain. e. Refer to Exhibit 451. Rank-order these firms in terms of their long-term liquidity risk. Do any of these firms appear unduly risky as of the end of fiscal 2015? Explain. Part B Part A of Integrath years 2013, 2014 mart and two other of Integrative Case 4.1 analyzed the profitability and risk of Walmart Stores for its fiscal 2013, 2014, and 2015. Part B of this case compares the profitability and risk ratios of Wal- d two other leading discount retailers, Carrefour and Target, for their 2013 through 2015 fiscal years Carrefour the world. Carrefour our headquartered in France, is Europe's largest retailer and the second largest retailer in did. Carrefour is organized by geographic region (France, Europe excluding France, Asia, Latin America). Each segment is organized according to store formats, which include the lowing (2015 number of stores in parentheses): Hypermarkets (1,481): Offer a wide variety of household and food products at compet- itively low prices under the Carrefour store brand. Supermarkets (3,462): Sell traditional grocery products under the Market, Bairro, and Supeco store brands. Convenience Stores (7,181): Offer a limited variety of food products in smaller stores than those of hypermarkets and supermarkets at aggressively low prices under Express, City, Contact, Bio, Montagne, and other store brands. Cash & Carry (172): Provides professional restaurant and shop owners food and non- food products at wholesale prices, under the Promocash and other store brands. Carrefour derived approximately 47% of its 2015 sales in France, 25% in Europe excluding France, 19% in Latin America, and 9% in Asia. Target Target Corporation, headquartered in the United States, is a retailer that includes large-format general merchandise and food discount stores as well as an online business at www.target.com. Target stores offer a wide variety of clothing, household, electronics, sports, toy, and entertain- ment products at discount prices. Target stores attempt to differentiate themselves from Wal- mart's discount stores by pushing trendy merchandising with more brand-name products. Target emphasizes customer service, referring to its customers as "guests" and focusing on the weme of "Expect More, Pay Less." Target Corporation attempts to differentiate itself from com- peutors by providing wider aisles and a less cluttered store appearance. Target discontinued its canadian operations in 2014, which led to a significant nonrecurring loss in that year. CHAPTER & Putty Any Walimator Bers et profita n ts riska n ts include the present Exhibits 449 and co n t profitability ratios for Carrefour, Target, and we 2013 through 2015 fica en E t 45t presents risk ratios for the three firmy presents selected other data for these firms. The financial statements include the of commitments under loses in property, plant and equipment and in long-term Exhibit 4.49 Carrefour, Target, and Walmart Cross-Section ROA Profitability Analysis (Integrative Case 4.1, Part B) ROA 2014 2015 3.7% Carrefour Target Walmart 3.09% 9.29 8.396 3.6% (2.596) 9.2% Assets Turnover Profit Margin for ROA 2013 2015 2014 2014 2013 2015 1.7 17 Carrefour Target Walmart 1.7% 5.1% 3.5% 2.196 (1.5%) 39% 2.196 3.796 3.896 24 24 23 Walmart 2015 2014 2013 2015 2014 2013 2015 100.0% 3.2% 79.6% Carrefour 2014 2013 100.0% 100.0% 3.0% 3.2% 80.0% 80.5% 100.0% 0.0% 70.5% 100.0% 0.0% 70.6% 100.0% 0.0% 70.2% 100.0% 0.7% 75.4% 100.0% 0.7% 75.7% 100.0% 0.7% 75,7% 22.0% Sales Other revenues Cost of goods sold Selling and administrative Interest expense Income taxes Profit margin for ROA* vables turnover Inventory turnover Fixed assets turnover b 20.4% 0.5% 0.8% 1.71% 13.6 136 9.7 65 19,8% 0.596 1.0% 2.13% 137 99 65 2149 1558228 19.79% 0.6% 08 2.14% 141 105 22* na 62 28.8% 1.2% 1.7% na 62 23.6% 20.3% 1.5% 0.5% 20% 14% 3.47% na 778 62 8 19,4% 0.5% 17% 3.85% 722 8 19,3% 0.5% 1.7% 3.8246 70.9 81 4.1 65 68 02 29 6.2 28 62 02 : 8.1 8.1 81 o red by on the stars reported incorre Exhibit 4.52 Carrefour, Target, and Walmart Selected Other Financial Data (Integrative Case 4.1, Part B) 2015 2014 2013 Growth Rate in Sales (0.3%) Carrefour 3.196 1.6% (0.77% 1.9% (1.0%) (2.8%) 1.6% 19% 12.296 1.792 11,528 10,860 1,790 11.453 10,100 1,793 10,942 Target Walmart Number of Stores Carrefour Target Walmart Square Footage (000s) Carrefour Target walmart Sales per Square Foot Carrefour 188,648 239,539 1,149,000 179,036 239,963 1,134,000 173,826 240,054 1,102,000 418 308 412 426 303 420 297 423 6,413,000 $ 41,175,000 $ 41,127,000 7.027,000 $ 40,569.000 $ 41.547,000 7,592,000 $ 39,754,000 $ 42,633,000 15,342 133,671 99,705 16,486 134,058 99,031 13,211 133,584 100,685 Target Walmart Sales per Store Carrefour Target Walmart Square Feet per Store Carrefour Target Walmart Fixed Assets per Square Foot Carrefour Target Walmart Sales per Employee Carrefour Target Walmart Exchange Rate U.S. dollars per euro () 69 105 108 110 105 96 101 $ $ 207,017 216,378 206,137 200,190 209,274 216,290 $ $ 210,580 194,751 212,042 $ $ $ 1.33 1.33 1.11 $ Exhibit 4.52 Carrefour, Target, and Walmart Selected Other Financial Data (Integrative Case 4.1, Part B) 2015 2014 2013 3.1% 1.6% (0.77% (0.3%) 1.996 1.9% (1.0%) (2.8%) 1.6% Growth Rate in Sales Carrefour Target Walmart Number of Stores Carrefour Target Walmart Square Footage (000) 12.296 1,792 11,528 10,860 1,790 11,453 10,100 1,793 10,942 Carrefour Target 188,648 239,539 1,149,000 179,036 239,963 1,134,000 173,826 240,054 1,102.000 418 308 412 426 303 420 297 423 Walmart Sales per Square Foot Carrefour Target Walmart Sales per Store Carrefour Target Walmart Square Feet per Store Carrefour Target Walmart Faed Assets per Square Foot Carrefour Target 6,413,000 $ 47,175,000 $ 41,127,000 7,027.000 $ 40,569,000 $ 41,547,000 67,592.000 $39754.000 $ 42.633.000 15,342 133,671 99,705 16,486 134,058 99,031 17,211 133,884 100,685 69 64 105 110 108 101 Walmart Sales per Employee Carrefour Target Walmart Exchange Rate U.S. dollars per euro (E) 207,017 216,378 206,137 $ $ $ $ $ 200,190 209,274 216,290 210,580 194,751 212,042 $ $ 1.11 $ 1.33 $ 1.33 CHAPTER 4 Profitability Analysis REQUIRED a. Walmart and Target follow somewhat different strategies. Using information in Exhi 4.49 and 4.52, suggest reasons for these differences in operating profitability. b. Walmart and Carrefour follow similar strategies, but Walmart consistently outperfor Carrefour on ROA. Using information in Exhibits 4.49 and 4.52, suggest reasons for the differences in operating profitability. c. Refer to Exhibit 4.50. Which firm appears to have used financial leverage most effectively in enhancing the rate of ROCE? Explain your reasoning. Note: Requirements d and e require coverage of material from Chapter 5. d. Refer to Exhibit 4.51. Rank-order these firms in terms of their short-term liquidity risk. Do any of these firms appear unduly risky as of the end of fiscal 2015? Explain. e. Refer to Exhibit 451. Rank-order these firms in terms of their long-term liquidity risk. Do any of these firms appear unduly risky as of the end of fiscal 2015? Explain. Part B Part A of Integrath years 2013, 2014 mart and two other of Integrative Case 4.1 analyzed the profitability and risk of Walmart Stores for its fiscal 2013, 2014, and 2015. Part B of this case compares the profitability and risk ratios of Wal- d two other leading discount retailers, Carrefour and Target, for their 2013 through 2015 fiscal years Carrefour the world. Carrefour our headquartered in France, is Europe's largest retailer and the second largest retailer in did. Carrefour is organized by geographic region (France, Europe excluding France, Asia, Latin America). Each segment is organized according to store formats, which include the lowing (2015 number of stores in parentheses): Hypermarkets (1,481): Offer a wide variety of household and food products at compet- itively low prices under the Carrefour store brand. Supermarkets (3,462): Sell traditional grocery products under the Market, Bairro, and Supeco store brands. Convenience Stores (7,181): Offer a limited variety of food products in smaller stores than those of hypermarkets and supermarkets at aggressively low prices under Express, City, Contact, Bio, Montagne, and other store brands. Cash & Carry (172): Provides professional restaurant and shop owners food and non- food products at wholesale prices, under the Promocash and other store brands. Carrefour derived approximately 47% of its 2015 sales in France, 25% in Europe excluding France, 19% in Latin America, and 9% in Asia. Target Target Corporation, headquartered in the United States, is a retailer that includes large-format general merchandise and food discount stores as well as an online business at www.target.com. Target stores offer a wide variety of clothing, household, electronics, sports, toy, and entertain- ment products at discount prices. Target stores attempt to differentiate themselves from Wal- mart's discount stores by pushing trendy merchandising with more brand-name products. Target emphasizes customer service, referring to its customers as "guests" and focusing on the weme of "Expect More, Pay Less." Target Corporation attempts to differentiate itself from com- peutors by providing wider aisles and a less cluttered store appearance. Target discontinued its canadian operations in 2014, which led to a significant nonrecurring loss in that year. CHAPTER & Putty Any Walimator Bers et profita n ts riska n ts include the present Exhibits 449 and co n t profitability ratios for Carrefour, Target, and we 2013 through 2015 fica en E t 45t presents risk ratios for the three firmy presents selected other data for these firms. The financial statements include the of commitments under loses in property, plant and equipment and in long-term Exhibit 4.49 Carrefour, Target, and Walmart Cross-Section ROA Profitability Analysis (Integrative Case 4.1, Part B) ROA 2014 2015 3.7% Carrefour Target Walmart 3.09% 9.29 8.396 3.6% (2.596) 9.2% Assets Turnover Profit Margin for ROA 2013 2015 2014 2014 2013 2015 1.7 17 Carrefour Target Walmart 1.7% 5.1% 3.5% 2.196 (1.5%) 39% 2.196 3.796 3.896 24 24 23 Walmart 2015 2014 2013 2015 2014 2013 2015 100.0% 3.2% 79.6% Carrefour 2014 2013 100.0% 100.0% 3.0% 3.2% 80.0% 80.5% 100.0% 0.0% 70.5% 100.0% 0.0% 70.6% 100.0% 0.0% 70.2% 100.0% 0.7% 75.4% 100.0% 0.7% 75.7% 100.0% 0.7% 75,7% 22.0% Sales Other revenues Cost of goods sold Selling and administrative Interest expense Income taxes Profit margin for ROA* vables turnover Inventory turnover Fixed assets turnover b 20.4% 0.5% 0.8% 1.71% 13.6 136 9.7 65 19,8% 0.596 1.0% 2.13% 137 99 65 2149 1558228 19.79% 0.6% 08 2.14% 141 105 22* na 62 28.8% 1.2% 1.7% na 62 23.6% 20.3% 1.5% 0.5% 20% 14% 3.47% na 778 62 8 19,4% 0.5% 17% 3.85% 722 8 19,3% 0.5% 1.7% 3.8246 70.9 81 4.1 65 68 02 29 6.2 28 62 02 : 8.1 8.1 81 o red by on the stars reported incorre Exhibit 4.52 Carrefour, Target, and Walmart Selected Other Financial Data (Integrative Case 4.1, Part B) 2015 2014 2013 Growth Rate in Sales (0.3%) Carrefour 3.196 1.6% (0.77% 1.9% (1.0%) (2.8%) 1.6% 19% 12.296 1.792 11,528 10,860 1,790 11.453 10,100 1,793 10,942 Target Walmart Number of Stores Carrefour Target Walmart Square Footage (000s) Carrefour Target walmart Sales per Square Foot Carrefour 188,648 239,539 1,149,000 179,036 239,963 1,134,000 173,826 240,054 1,102,000 418 308 412 426 303 420 297 423 6,413,000 $ 41,175,000 $ 41,127,000 7.027,000 $ 40,569.000 $ 41.547,000 7,592,000 $ 39,754,000 $ 42,633,000 15,342 133,671 99,705 16,486 134,058 99,031 13,211 133,584 100,685 Target Walmart Sales per Store Carrefour Target Walmart Square Feet per Store Carrefour Target Walmart Fixed Assets per Square Foot Carrefour Target Walmart Sales per Employee Carrefour Target Walmart Exchange Rate U.S. dollars per euro () 69 105 108 110 105 96 101 $ $ 207,017 216,378 206,137 200,190 209,274 216,290 $ $ 210,580 194,751 212,042 $ $ $ 1.33 1.33 1.11 $ Exhibit 4.52 Carrefour, Target, and Walmart Selected Other Financial Data (Integrative Case 4.1, Part B) 2015 2014 2013 3.1% 1.6% (0.77% (0.3%) 1.996 1.9% (1.0%) (2.8%) 1.6% Growth Rate in Sales Carrefour Target Walmart Number of Stores Carrefour Target Walmart Square Footage (000) 12.296 1,792 11,528 10,860 1,790 11,453 10,100 1,793 10,942 Carrefour Target 188,648 239,539 1,149,000 179,036 239,963 1,134,000 173,826 240,054 1,102.000 418 308 412 426 303 420 297 423 Walmart Sales per Square Foot Carrefour Target Walmart Sales per Store Carrefour Target Walmart Square Feet per Store Carrefour Target Walmart Faed Assets per Square Foot Carrefour Target 6,413,000 $ 47,175,000 $ 41,127,000 7,027.000 $ 40,569,000 $ 41,547,000 67,592.000 $39754.000 $ 42.633.000 15,342 133,671 99,705 16,486 134,058 99,031 17,211 133,884 100,685 69 64 105 110 108 101 Walmart Sales per Employee Carrefour Target Walmart Exchange Rate U.S. dollars per euro (E) 207,017 216,378 206,137 $ $ $ $ $ 200,190 209,274 216,290 210,580 194,751 212,042 $ $ 1.11 $ 1.33 $ 1.33
Step by Step Solution
There are 3 Steps involved in it

Get step-by-step solutions from verified subject matter experts