

Question: please help answer correctly. thank you Handout: Interpreting Kinetics Data Two experiments were done to study the reaction AB. Experiment I started with an initial
please help answer correctly. thank you 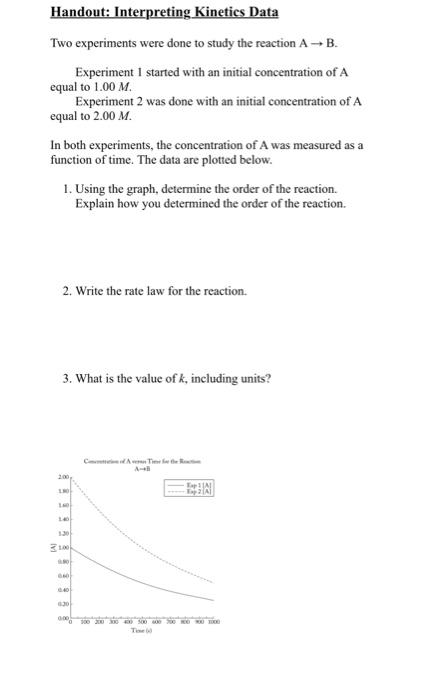
Handout: Interpreting Kinetics Data Two experiments were done to study the reaction AB. Experiment I started with an initial concentration of A equal to 1.00 M Experiment 2 was done with an initial concentration of A equal to 2.00 M. In both experiments, the concentration of A was measured as a function of time. The data are plotted below. 1. Using the graph, determine the order of the reaction. Explain how you determined the order of the reaction. 2. Write the rate law for the reaction. 3. What is the value of k, including units? 1.30 100 0.30 0.00
Step by Step Solution
There are 3 Steps involved in it
1 Expert Approved Answer
Step: 1 Unlock

Question Has Been Solved by an Expert!
Get step-by-step solutions from verified subject matter experts
Step: 2 Unlock
Step: 3 Unlock