

Question: Please help answer Exercise 5 portion only (Linear Algebra): Note that imshow function has 0 representing the darkest intensity pixel (black) and 16 representing the
Please help answer Exercise 5 portion only (Linear Algebra):
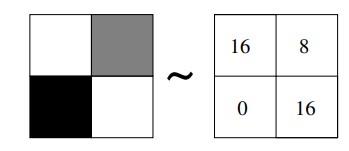
Note that imshow function has 0 representing the darkest intensity pixel (black) and 16 representing the lightest intensity pixel (white). Below is an image to explain it better.
In other words for a, what happens if it exceeds negative for 0 and a number more than 16? Please answer a,b,c
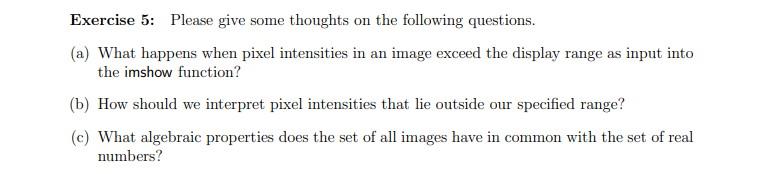
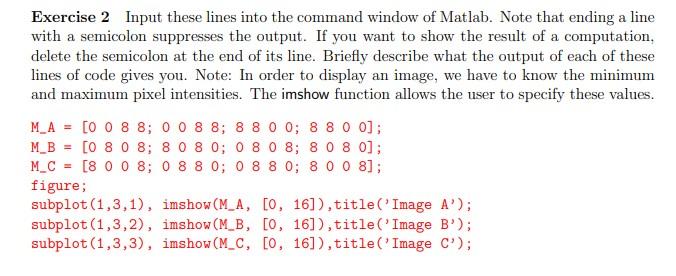
Exercise 5: Please give some thoughts on the following questions. (a) What happens when pixel intensities in an image exceed the display range as input into the imshow function? (b) How should we interpret pixel intensities that lie outside our specified range? (c) What algebraic properties does the set of all images have in common with the set of real numbers? 16 8 ~ 0 16 Exercise 2 Input these lines into the command window of Matlab. Note that ending a line with a semicolon suppresses the output. If you want to show the result of a computation, delete the semicolon at the end of its line. Briefly describe what the output of each of these lines of code gives you. Note: In order to display an image, we have to know the minimum and maximum pixel intensities. The imshow function allows the user to specify these values. M_A = [0 0 8 8; 0 0 8 8; 8 8 0 0; 8 8 0 0]; M_B = [0 8 0 8; 8 0 8 0; 0 8 0 8; 8 0 8 0); M_C = [8 0 0 8; 0 8 8 0; 0 8 8 0; 8 0 0 8]; figure; subplot(1,3,1), imshow(M_A, [0, 16]), title('Image A'); subplot(1,3,2), imshow(M_B, [0, 16]), title('Image B'); subplot(1,3,3), imshow(M_C, [0, 16]), title('Image C'); Exercise 5: Please give some thoughts on the following questions. (a) What happens when pixel intensities in an image exceed the display range as input into the imshow function? (b) How should we interpret pixel intensities that lie outside our specified range? (c) What algebraic properties does the set of all images have in common with the set of real numbers? 16 8 ~ 0 16 Exercise 2 Input these lines into the command window of Matlab. Note that ending a line with a semicolon suppresses the output. If you want to show the result of a computation, delete the semicolon at the end of its line. Briefly describe what the output of each of these lines of code gives you. Note: In order to display an image, we have to know the minimum and maximum pixel intensities. The imshow function allows the user to specify these values. M_A = [0 0 8 8; 0 0 8 8; 8 8 0 0; 8 8 0 0]; M_B = [0 8 0 8; 8 0 8 0; 0 8 0 8; 8 0 8 0); M_C = [8 0 0 8; 0 8 8 0; 0 8 8 0; 8 0 0 8]; figure; subplot(1,3,1), imshow(M_A, [0, 16]), title('Image A'); subplot(1,3,2), imshow(M_B, [0, 16]), title('Image B'); subplot(1,3,3), imshow(M_C, [0, 16]), title('Image C')
Step by Step Solution
There are 3 Steps involved in it

Get step-by-step solutions from verified subject matter experts