

Question: Please help answer questions below. I attached in pictures format. Thanks Problem:1] .The average price -of personal-computers.manufactured by-MINM-Company is- ) by Outletra Ex What's the
Please help answer questions below. I attached in pictures format. Thanks
![Please help answer questions below. I attached in pictures format. Thanks Problem:1]](https://dsd5zvtm8ll6.cloudfront.net/si.experts.images/questions/2024/10/67061c4fc521d_71167061c4fa718f.jpg)
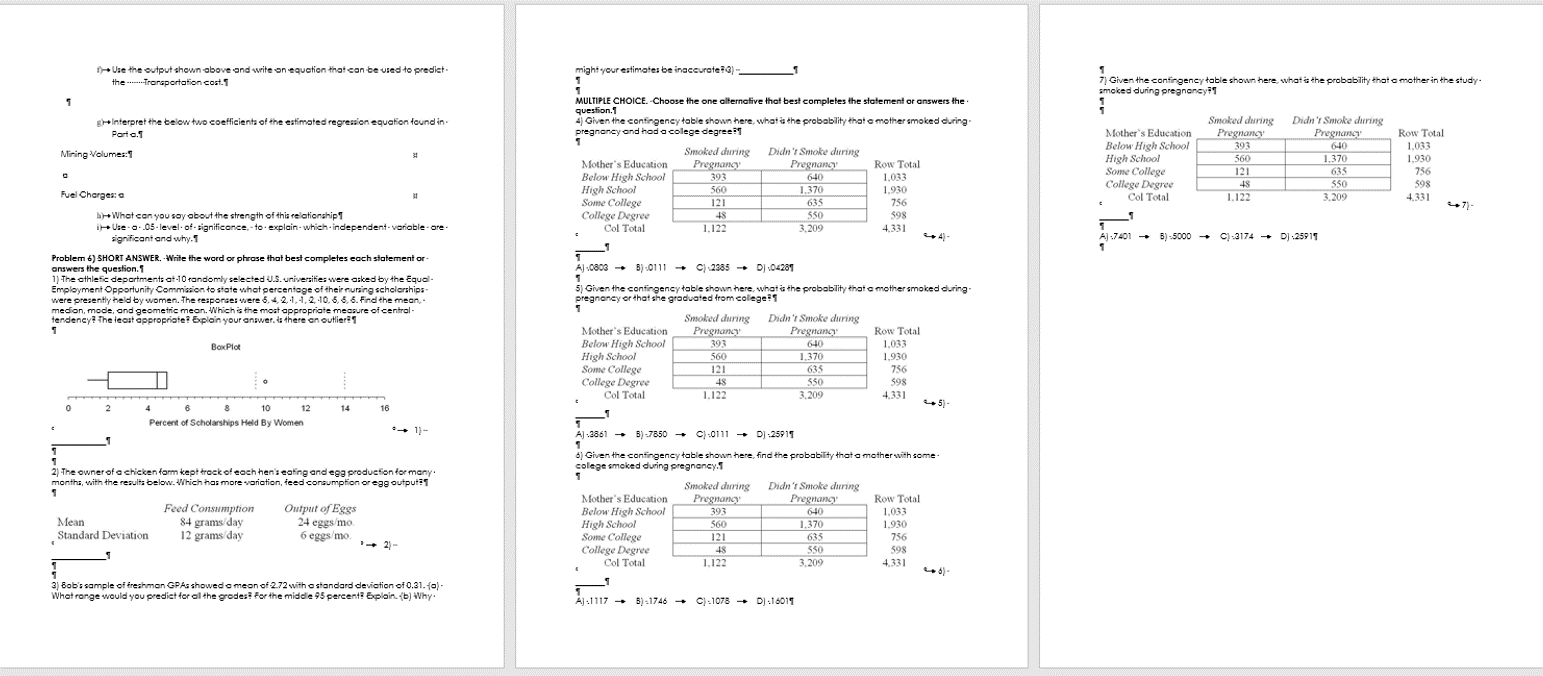
Problem:1] .The average price -of personal-computers.manufactured by-MINM-Company is- ) by Outletra Ex What's the sample mean of the data! # you use a 62 significance level, would you conclude $1,200 with a standard deviation of $220. . furthermore, it is known that the computer prices. How many t-shirts will goo that the mean life of the batteries is typically more than -100 hours? -Explain your answer. 1 manufactured by MNM are normally distributed. .DO NOT ROUND YOUR NUMBERS.1 Marketa Total Only- to d.+If you were to use a-19 significance level in this case, would you conclude that the mean life marketa Seasonal. Only- to Factory . To. both of the batteries is typically more than .100 hours? -Explain your answer. 1 market:a $1,530#1 a. -+ What is the probability that a randomly selected computer wil have a price of at least- y paleo Outleta Computers with-prices.of-more than-$1,750-receive.a-discount. ..What percentage of .the- Seasonal . Sole 280000 Problem 41 computers will receive the dacount?a [Discount)a The following results were obtained from a multiple regression analysis of Wishideen supermarket- Factory outleto 220000 profitability. -The dependent variable, -Y, is the profit (in Hundred of dollars) and the independent- variables, *iand 1s, are the food sales and nonfood sales fin thousands of dollars).1 Coefficient Standard Bror + t-value + p-valuef agment . Segment. -15.0821 What are the mi um and the maximum values of the middle 95% of computer pricesin by Segment:o . Constant -+ X1 0.0972 0.054+ + 0.075+ 0.1321 Totala 0.2484 0.092- 4 + 3.457- - 0.00759 Minimum value:a Maximum. Problem 3)1 . Coefficient of determination = 0.71391 value:n -...-BetCos[The-Battery-Company]-produces your typical-consumer-battery.--The-company . claims that their batteries last at least-100 hours, on average. -.Your experience with the I Use the output shown above and write on equation that can be used to predict- BelCo battery has been somewhat different, so you decide to conduct a test to see if the. the .monthly sales.1 Problem 21 Loseste t-shirts come with an average price of $120 a piece, at their factory outlet- with a sid, deviation of $17. But at the Seasonal Sale .{Discount) outlets of these t-shirts, it was companies claim is true. You believe that the meon life is actuallyless than the-100 hours . b) +Interpret the coefficients of the estimated regression equation found in Part a. 1 abo-drawing -good -crowd: .where .the . average. price, .after-diecount, -was . $-75 . and.id Be Co claims. . You decide to collect data on-the average battery .Ie .[in hour:) -of .a. c)-+What can you say about the strength of this relationship ? 1 deviation of $-16. {Amume the distributions are both Normal]. - andom som.t and the information related to the hypothesis test is presented below.-1 d) + Carry out-a test of whether Xi and-Yare significantly related. .Use a.05 level.of. significance.1 Test of- 4 2100 versus one-failed alternatives # c)-+ Carry.out-a . test- of whether .X:and . Yis significantly-related. . .Use .@-.05 .level. of. significance.1 Three specific segments of customers can be expected to form, onacecult. One below the. awest price tag of the factory outlet (segment-(), one above the uppermost price level of the Hypothesized meana 100.0a Seasonal Sale {segment-ll) and the third (segment-ll) in betweena Sample meana 98.50 Problem 5.) for a company below are monthly data on the transportation cost of its operations.. The cost comes as a result of mining volumes, fuel charges and local food taxes in each month. - " the market size of this brand Lacoste was decided at 22,000 pieces at the factory outlets . Sid error of meana 0.7778 These three variables more or less decide the total transportation cost the company incurs. and another-28,000-pieces for Seasonal Sale, how many pieces of t-shirts-fout of this total of- 50,000 pieces] can actualbube ascertained for each of the above three market segments! . Degrees of freedoma -190 Coefficienta Sid Era t-valuea p-valueon Hint: Some piece picked by consumers only at factory outlets. come by customers orly- ason. sale. . The . remaining-can-be . picked-up-by-customers-in-both- markets. - Drow- test statistica -1.9320 Constanta -129.2135a 105.41510 -1.22580 0.2380a3 appropriate diagrams and clearly ilustrate decision making zone:.a -valued 0.034 Mining Volumes fin.000 tonne:ja -0.247 4a 0.171 da -1.44190 0.168day Fuel Charges - in $ per tonnea 9.1948a 2.8312a 3.24770 0.0050au ) .Draw appropriate . diagrams, write Excel formulae -and.ilustrate .decision .area: relevant . # a.+Can the sample size be determined from the information above! .Yes or no? -if yes, what is. Road Taxes - in $ pertonnea 23.810ga 3.95430 8.49970 0.0000aH valuesin the sample size in this come:f bj fil up the empty {non-darkened] boxes in the two tables belowa b.+You believe that the mean ffe i actualy less than-100 hours, should you conduct a one-toiled or a two-tailed hypothesis testi -Explain your answer. 1 -+ Coefficient of determination = 0.91391()* Use the output shown above and write on equation that can be used to predict. might your estimates be inaccurate!3)- the-..-..Transportation cost.1 7) Given the contingency table shown here, what's the probability that a mother in the study. MULTIPLE CHOICE. -Choose the one alternative that best completes the statement or answers the . smoked during pregnancy #1 question.1 (Interpret the below two coefficients of the estimated regression equation found in. 4) Given the contingency table shown here, what's the probability that a mother smoked during. Smoked during Didn't Smoke during Part a.1 pregnancy and had a college degree:1 Mother's Education Pregnancy Pregnancy Row Total Smoked during Below High School 640 1.033 Mining Volumes: 1 Didn't Spoke during 393 Mother's Education Pregnancy Pregnancy Row Total High School 560 1,370 1.930 Below High School 393 640 1.033 Some College 121 635 756 High School 560 1.370 1.930 College Degree 48 550 598 Fuel Charges: a Some College 121 635 756 Col Total 1.122 3.209 4.331 by . What can you say about the strength of this relationship 1 College Degree 48 $50 598 i) + Use - a . .05- level. of- significance, - to . explain- which - independent- variable - are. Col Total 1.122 3.209 4.331 significant and why. 1 AJ:7401 -* 6):5000 - CJ:3174 - DJ :25917 Problem *) SHORT ANSWER. . Write the ward or phrase that best completes each statement or - answers the question. 1 AJ :0803 - 5)10111 - C):2385 - DJ :04281 1/ The athletic departments at-10 randomly selected U.S. universities were asked by the Equal Employment Opportunity Commacion to state what percentage of their nursing scholarships 5) Given the contingency table shown here, what is the probability that a mother smoked during were presently held by women. The response: were 5, 4, 2, 1, -1, 2, 10, 5, 6, 6. Find the mean,- pregnancy or that she graduated from college: 1 medion, mode, and geometric mean. Which is the most appropriate measure of central tendency? The least appropriate: Explain your answer. : there on outlier: 1 Smoked during Didn't Smoke during Mother's Education Pregnancy Pregnancy Row Total BoxPlot Below High School 393 640 1.033 High School 560 1.370 1.930 Some College 121 635 756 College Degree 48 550 598 Col Total 1.122 3.205 4.331 2 6 10 Percent of Scholarships Held By Women :+ 1)- A] :2861 - B)-7850 - C):0111 -> DJ :25917 ") Given the contingency table shown here, find the probability that a mother with some The owner of a chicken farm kept track of each hen's eating and egg production for many . collage smoked during pregnancy. months, with the results below. Which has more variation, feed consumption or egg output?i Smoked during Didn't Smoke during Row Total Feed Consumption Output of Eggs Mother's Education Pregnancy Pregnancy 39 640 1,033 84 grams/day Below High School Mean 24 eggs/mo. High School 56 1.370 1.930 Standard Deviation 12 grams/day 6 eggs/mo. 1 + 2 Some College 121 635 756 College Degree 48 $50 598 Col Total ,122 3,209 4.331 3) Bob's sample of freshman GPAs showed a mean of -2.72 with a standard deviation of 0.31. (o)- What range would you predict for al the grades! For the middle 95 percent! Explain. (b) Why. AJ:1117 - B)=1748 - C):1078 - DJ .18019
Step by Step Solution
There are 3 Steps involved in it

Get step-by-step solutions from verified subject matter experts