

Question: Please help answer the below two questions. Scatter Diagram and the Line of Best Fit Conceptual Overview Explore how the rela anthip between two menbed
Please help answer the below two questions.
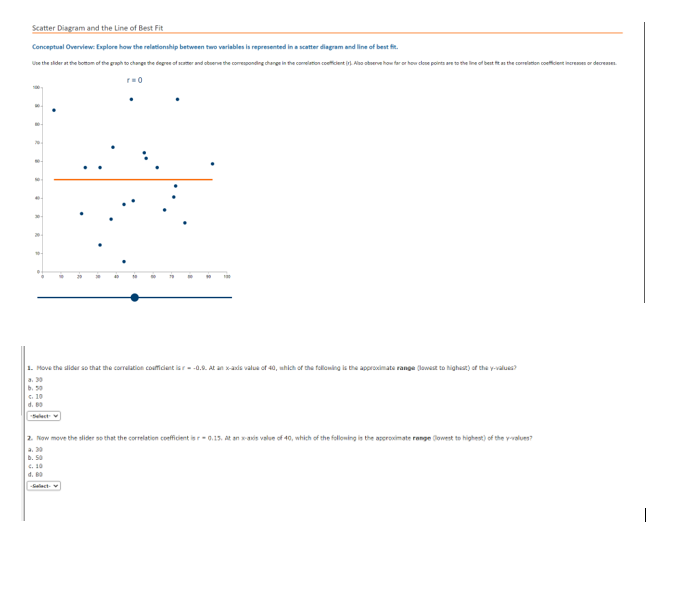
Scatter Diagram and the Line of Best Fit Conceptual Overview Explore how the rela anthip between two menbed in a scatter diagram and line of best fir. When the older at the bottom of the jeph to change the 1. Move the wilder so that the correlation couriclast bar = -0.9. At an x-axis value of 40, which of the following is the approximate range (lawace In highest) of the y-values? G. 10 2. Now move the wilder so that the correlation confficdent in or = 0.15. at on x-ads value of 40, which of the following in the approximate range Downt to higher!) of the pvolum? b. 50
Step by Step Solution
There are 3 Steps involved in it
1 Expert Approved Answer
Step: 1 Unlock

Question Has Been Solved by an Expert!
Get step-by-step solutions from verified subject matter experts
Step: 2 Unlock
Step: 3 Unlock