

Question: Please help answer the following questions. It Is customary to approximate the data within a scatterplot using a 'trendline'. The converting of the scattered points
Please help answer the following questions.
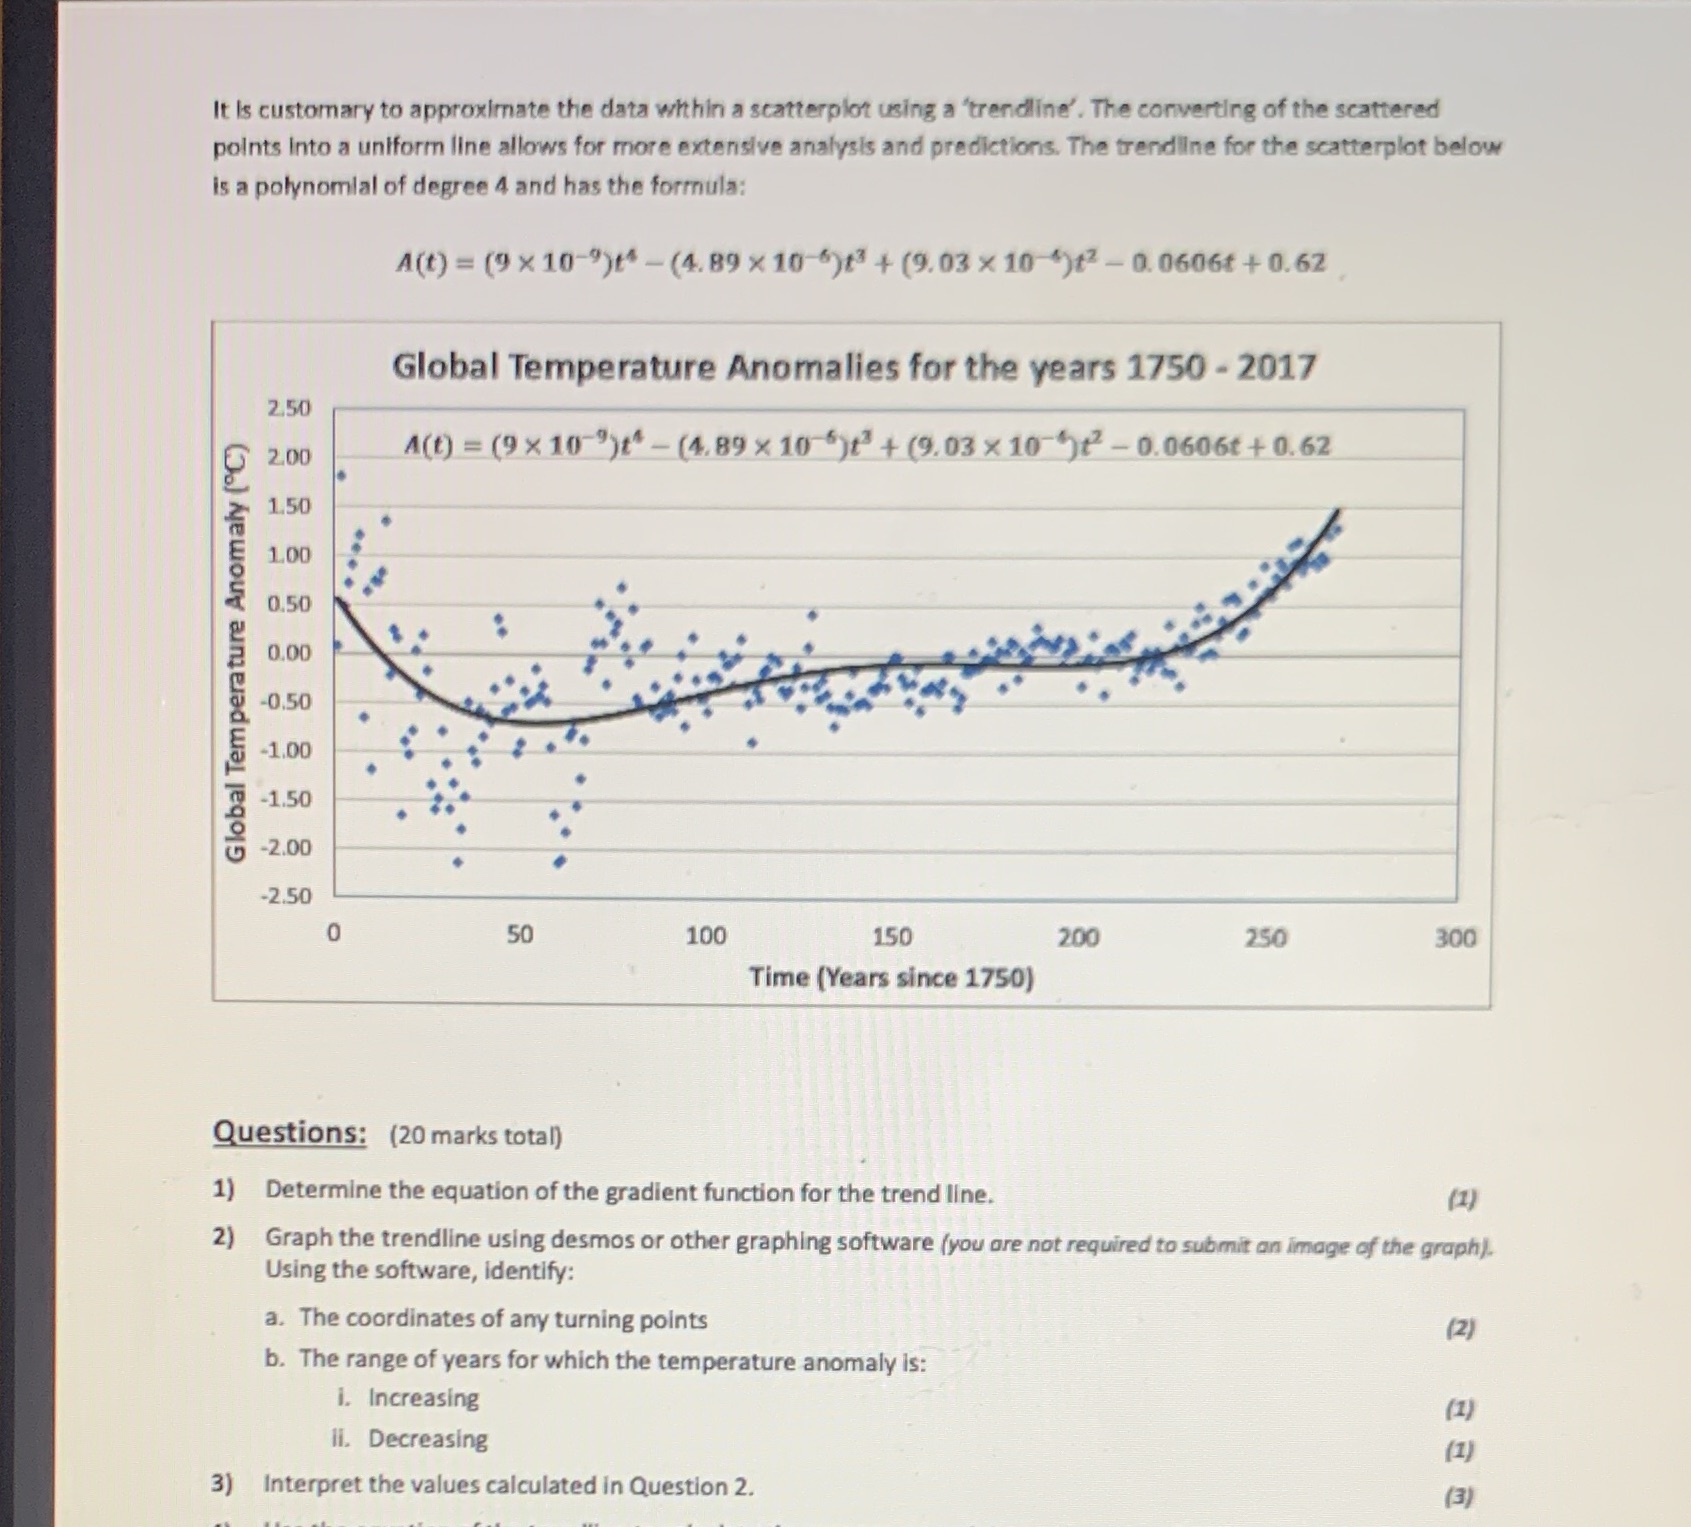
It Is customary to approximate the data within a scatterplot using a 'trendline'. The converting of the scattered points Into a uniform line allows for more exterisive analysis and predictions. The trendline for the scatterplot below is a polynomial of degree 4 and has the formula: A(t) = (9x10-")+" - (4. 89 x 10 6)13 + (9.03 x 10 ")12 - 0. 06061 + 0.62 Global Temperature Anomalies for the years 1750 - 2017 2.50 2.00 A(t) = (9x10 9)2" - (4.89 x 10 5)1 + (9.03 x 10 912 - 0.0606t + 0.62 150 LO 0.50 0.00 Global Temperature Anomaly ( -0.50 -1.00 -1.50 -2.00 -2.50 0 50 100 150 200 250 300 Time (Years since 1750) Questions: (20 marks total) 1) Determine the equation of the gradient function for the trend line. (1) 2) Graph the trendline using desmos or other graphing software (you are not required to submit an image of the graph). Using the software, identify: a. The coordinates of any turning points (2) b. The range of years for which the temperature anomaly is: i. Increasing (1) li. Decreasing (1) 3) Interpret the values calculated in Question 2. (3)
Step by Step Solution
There are 3 Steps involved in it

Get step-by-step solutions from verified subject matter experts