

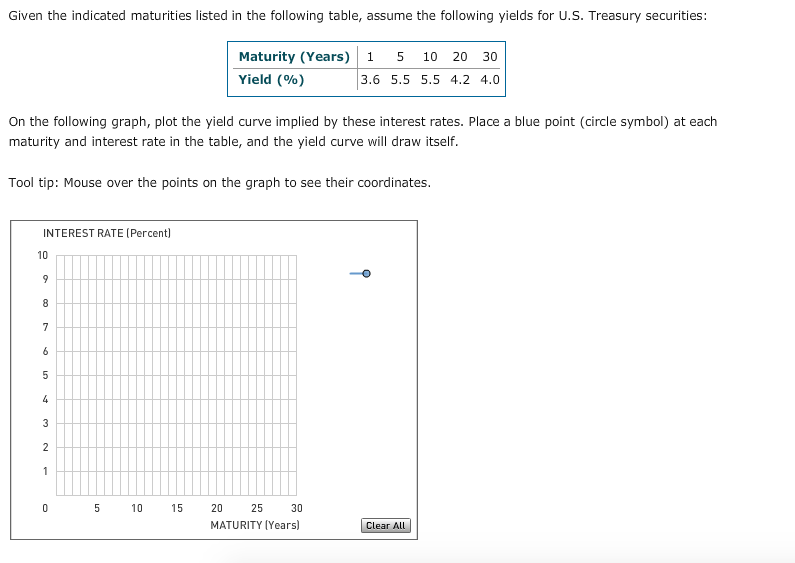
Question: Please help answer the following questions. Thank you! Given the indicated maturities listed in the following table, assume the following yields for U.S. Treasury securities
 Please help answer the following questions. Thank you!
Given the indicated maturities listed in the following table, assume the following yields for U.S. Treasury securities Maturity (Years 1 5 10 20 30 Yield 3.6 5.5 5.5 4.2 4.0 On the following graph, plot the yield curve implied by these interest rates. Place a blue point (circle symbol) at each maturity and interest rate in the table, and the yield curve will draw itself Tool tip: Mouse over the points on the graph to see their coordinates. INTEREST RATE (Percent 10 10 15 20 25 30 MATURITY (Years) Clear A
Step by Step Solution
There are 3 Steps involved in it
1 Expert Approved Answer
Step: 1 Unlock

Question Has Been Solved by an Expert!
Get step-by-step solutions from verified subject matter experts
Step: 2 Unlock
Step: 3 Unlock