

Question: Please help answer the problem in the screenshots. Thnaks! .. Now please define a function learn_and_visual_mse that trains a linear classifier (i.e., compute w=(XTX)1XTy )
Please help answer the problem in the screenshots. Thnaks!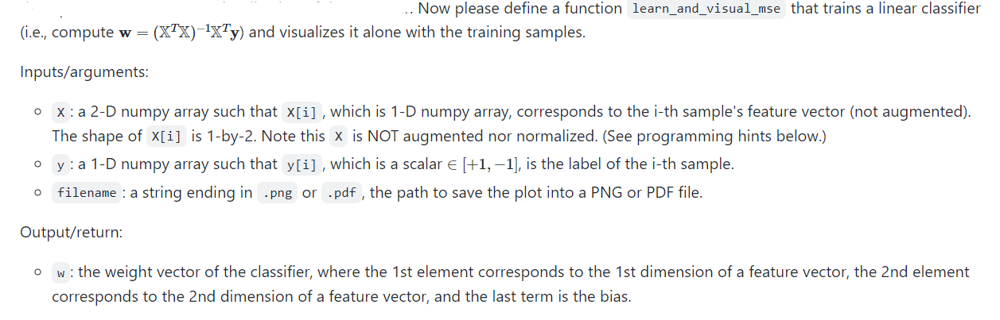
.. Now please define a function learn_and_visual_mse that trains a linear classifier (i.e., compute w=(XTX)1XTy ) and visualizes it alone with the training samples. Inputs/arguments: - x : a 2-D numpy array such that x[i], which is 1-D numpy array, corresponds to the i-th sample's feature vector (not augmented). The shape of x[i] is 1-by-2. Note this x is NOT augmented nor normalized. (See programming hints below.) - y : a 1-D numpy array such that y[i], which is a scalar [+1,1], is the label of the i-th sample. - : a string ending in or , the path to save the plot into a PNG or PDF file. Output/return: - the weight vector of the classifier, where the 1st element corresponds to the 1st dimension of a feature vector, the 2nd element corresponds to the 2 nd dimension of a feature vector, and the last term is the bias
Step by Step Solution
There are 3 Steps involved in it

Get step-by-step solutions from verified subject matter experts