

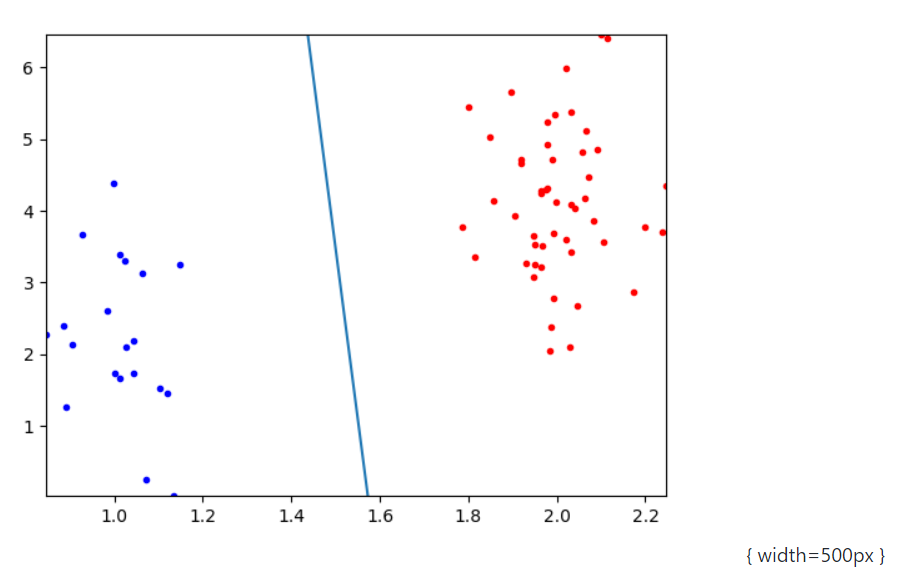
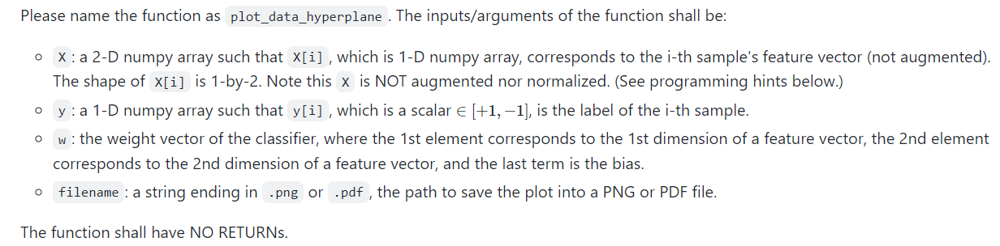
Question: Please help answer the problem in the screenshots. Thnaks! 2-D scatter plots and line plots. { width =500px} Please name the function as plot_data_hyperplane. The
Please help answer the problem in the screenshots. Thnaks!
![numpy array such that x[i], which is 1-D numpy array, corresponds to](https://dsd5zvtm8ll6.cloudfront.net/si.experts.images/questions/2024/09/66f3e9c571f3e_12566f3e9c50c0b1.jpg)
![the i-th sample's feature vector (not augmented). The shape of x[i] is](https://dsd5zvtm8ll6.cloudfront.net/si.experts.images/questions/2024/09/66f3e9c60fa33_12566f3e9c5a7906.jpg)
2-D scatter plots and line plots. { width =500px} Please name the function as plot_data_hyperplane. The inputs/arguments of the function shall be: - x : a 2-D numpy array such that x[i], which is 1-D numpy array, corresponds to the i-th sample's feature vector (not augmented). The shape of x[i] is 1-by-2. Note this x is NOT augmented nor normalized. (See programming hints below.) - y : a 1-D numpy array such that y[i], which is a scalar [+1,1], is the label of the i-th sample. - w : the weight vector of the classifier, where the 1st element corresponds to the 1 st dimension of a feature vector, the 2 nd element corresponds to the 2 nd dimension of a feature vector, and the last term is the bias. : a string ending in or the path to save the plot into a PNG or PDF file. The function shall have NO RETURNs
Step by Step Solution
There are 3 Steps involved in it

Get step-by-step solutions from verified subject matter experts