

Question: Please help answer the questions below the chart (using the chart above). Table 1: Real GDP and Its Components Year 0 Year 1 Year 2
Please help answer the questions below the chart (using the chart above).
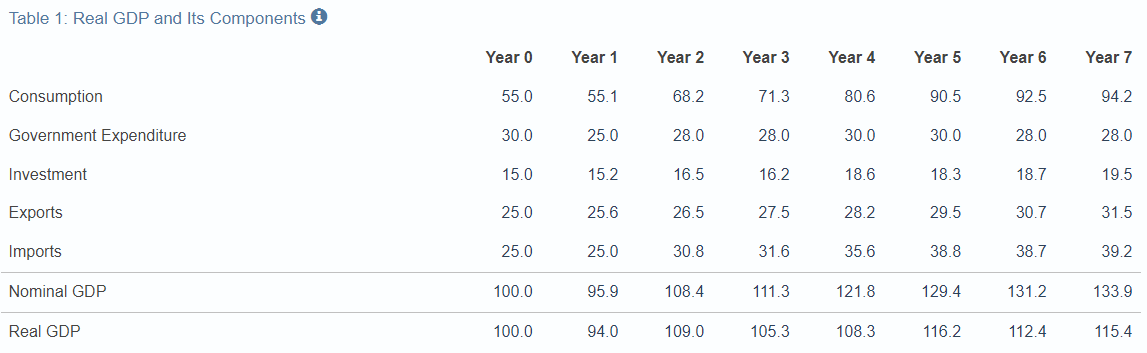
Table 1: Real GDP and Its Components Year 0 Year 1 Year 2 Year 3 Year 4 Year 5 Year 6 Year 7 Consumption 55.0 55.1 68.2 71.3 80.6 90.5 92.5 94.2 Government Expenditure 30.0 25.0 28.0 28.0 30.0 30.0 28.0 28.0 Investment 15.0 15.2 16.5 16.2 18.6 18.3 18.7 19.5 Exports 25.0 25.6 26.5 27.5 28.2 29.5 30.7 31.5 Imports 25.0 25.0 30.8 31.6 35.6 38.8 38.7 39.2 Nominal GDP 100.0 95.9 108.4 111.3 121.8 129.4 131.2 133.9 Real GDP 100.0 94.0 109.0 105.3 108.3 116.2 112.4 115.4
Step by Step Solution
There are 3 Steps involved in it
1 Expert Approved Answer
Step: 1 Unlock

Question Has Been Solved by an Expert!
Get step-by-step solutions from verified subject matter experts
Step: 2 Unlock
Step: 3 Unlock