

Question: please help Answer the statistical measures and create a box and whiskers plot for the following set of data. 1, 3, 5, 6, 8, 9,
please help
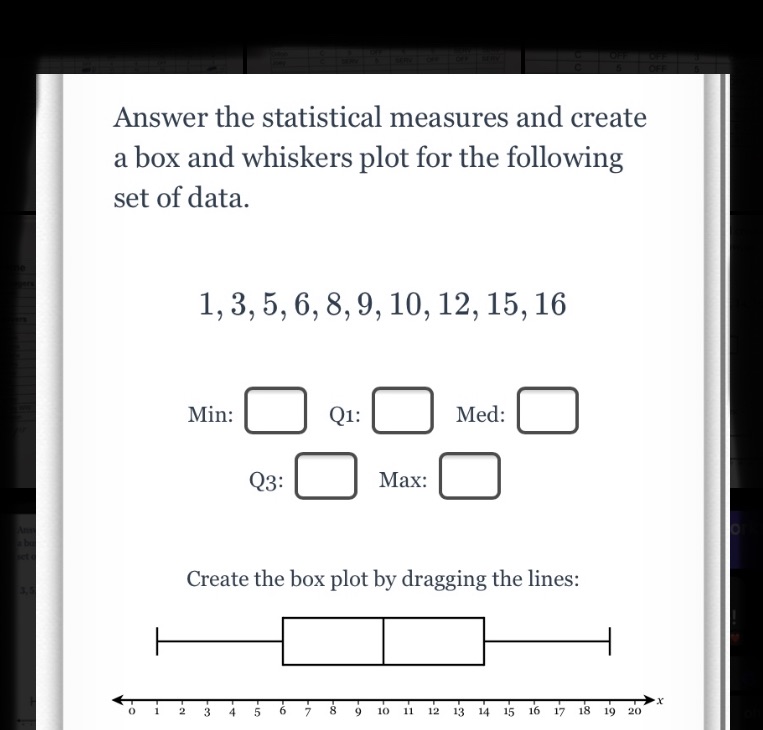
Answer the statistical measures and create a box and whiskers plot for the following set of data. 1, 3, 5, 6, 8, 9, 10, 12, 15, 16 Min: Q1: Med: Q3: Max: Create the box plot by dragging the lines: *7 1 2 : 4 5 9 10 11 12 13 14 15 16 17 18 19 20
Step by Step Solution
There are 3 Steps involved in it
1 Expert Approved Answer
Step: 1 Unlock

Question Has Been Solved by an Expert!
Get step-by-step solutions from verified subject matter experts
Step: 2 Unlock
Step: 3 Unlock