

Question: please help answer:) The table below shows standard deviations and correlation coefficients for seven stocks from different countries. Calculate the variance of a portfolio with
 please help answer:)
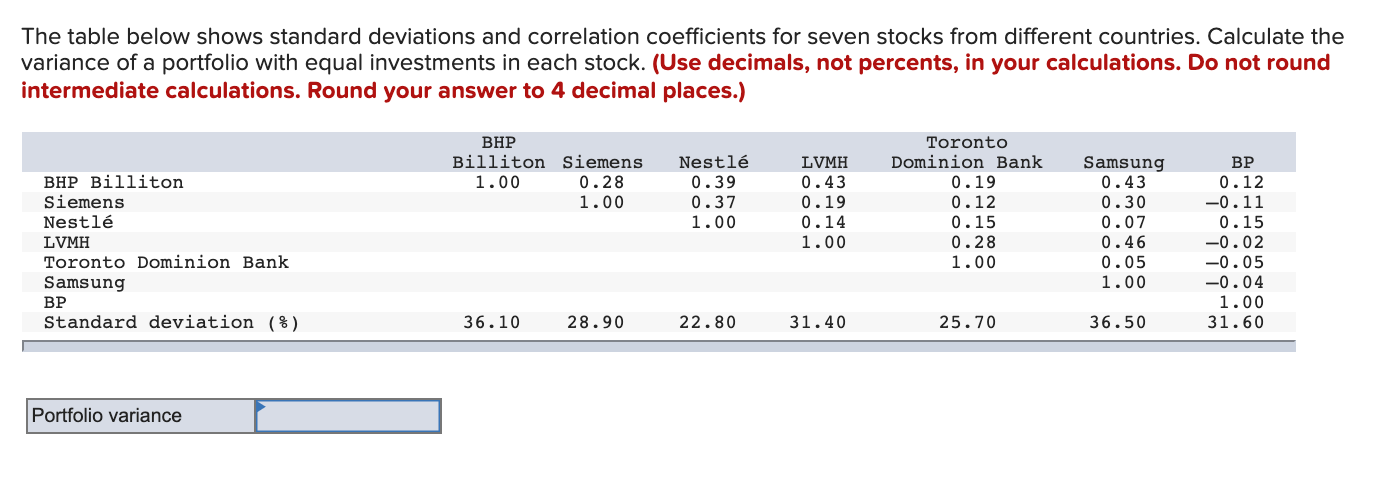
The table below shows standard deviations and correlation coefficients for seven stocks from different countries. Calculate the variance of a portfolio with equal investments in each stock. (Use decimals, not percents, in your calculations. Do not round intermediate calculations. Round your answer to 4 decimal places.) BHP Billiton Siemens 1.00 0.28 1.00 Nestl 0.39 0.37 1.00 LVMH 0.43 0.19 0.14 1.00 BHP Billiton Siemens Nestl LVMH Toronto Dominion Bank Samsung BP Standard deviation (%) Toronto Dominion Bank 0.19 0.12 0.15 0.28 1.00 Samsung 0.43 0.30 0.07 0.46 0.05 1.00 BP 0.12 -0.11 0.15 -0.02 -0.05 -0.04 1.00 31.60 36.10 28.90 22.80 31.40 25.70 36.50 Portfolio variance The table below shows standard deviations and correlation coefficients for seven stocks from different countries. Calculate the variance of a portfolio with equal investments in each stock. (Use decimals, not percents, in your calculations. Do not round intermediate calculations. Round your answer to 4 decimal places.) BHP Billiton Siemens 1.00 0.28 1.00 Nestl 0.39 0.37 1.00 LVMH 0.43 0.19 0.14 1.00 BHP Billiton Siemens Nestl LVMH Toronto Dominion Bank Samsung BP Standard deviation (%) Toronto Dominion Bank 0.19 0.12 0.15 0.28 1.00 Samsung 0.43 0.30 0.07 0.46 0.05 1.00 BP 0.12 -0.11 0.15 -0.02 -0.05 -0.04 1.00 31.60 36.10 28.90 22.80 31.40 25.70 36.50 Portfolio variance
Step by Step Solution
There are 3 Steps involved in it

Get step-by-step solutions from verified subject matter experts