

Question: Please help answering the highlighted questions 6(a,b)-10. Second Linear Regression A linear regression using SPSS was conducted with religiosity (how often you attend religious services)
Please help answering the highlighted questions 6(a,b)-10.
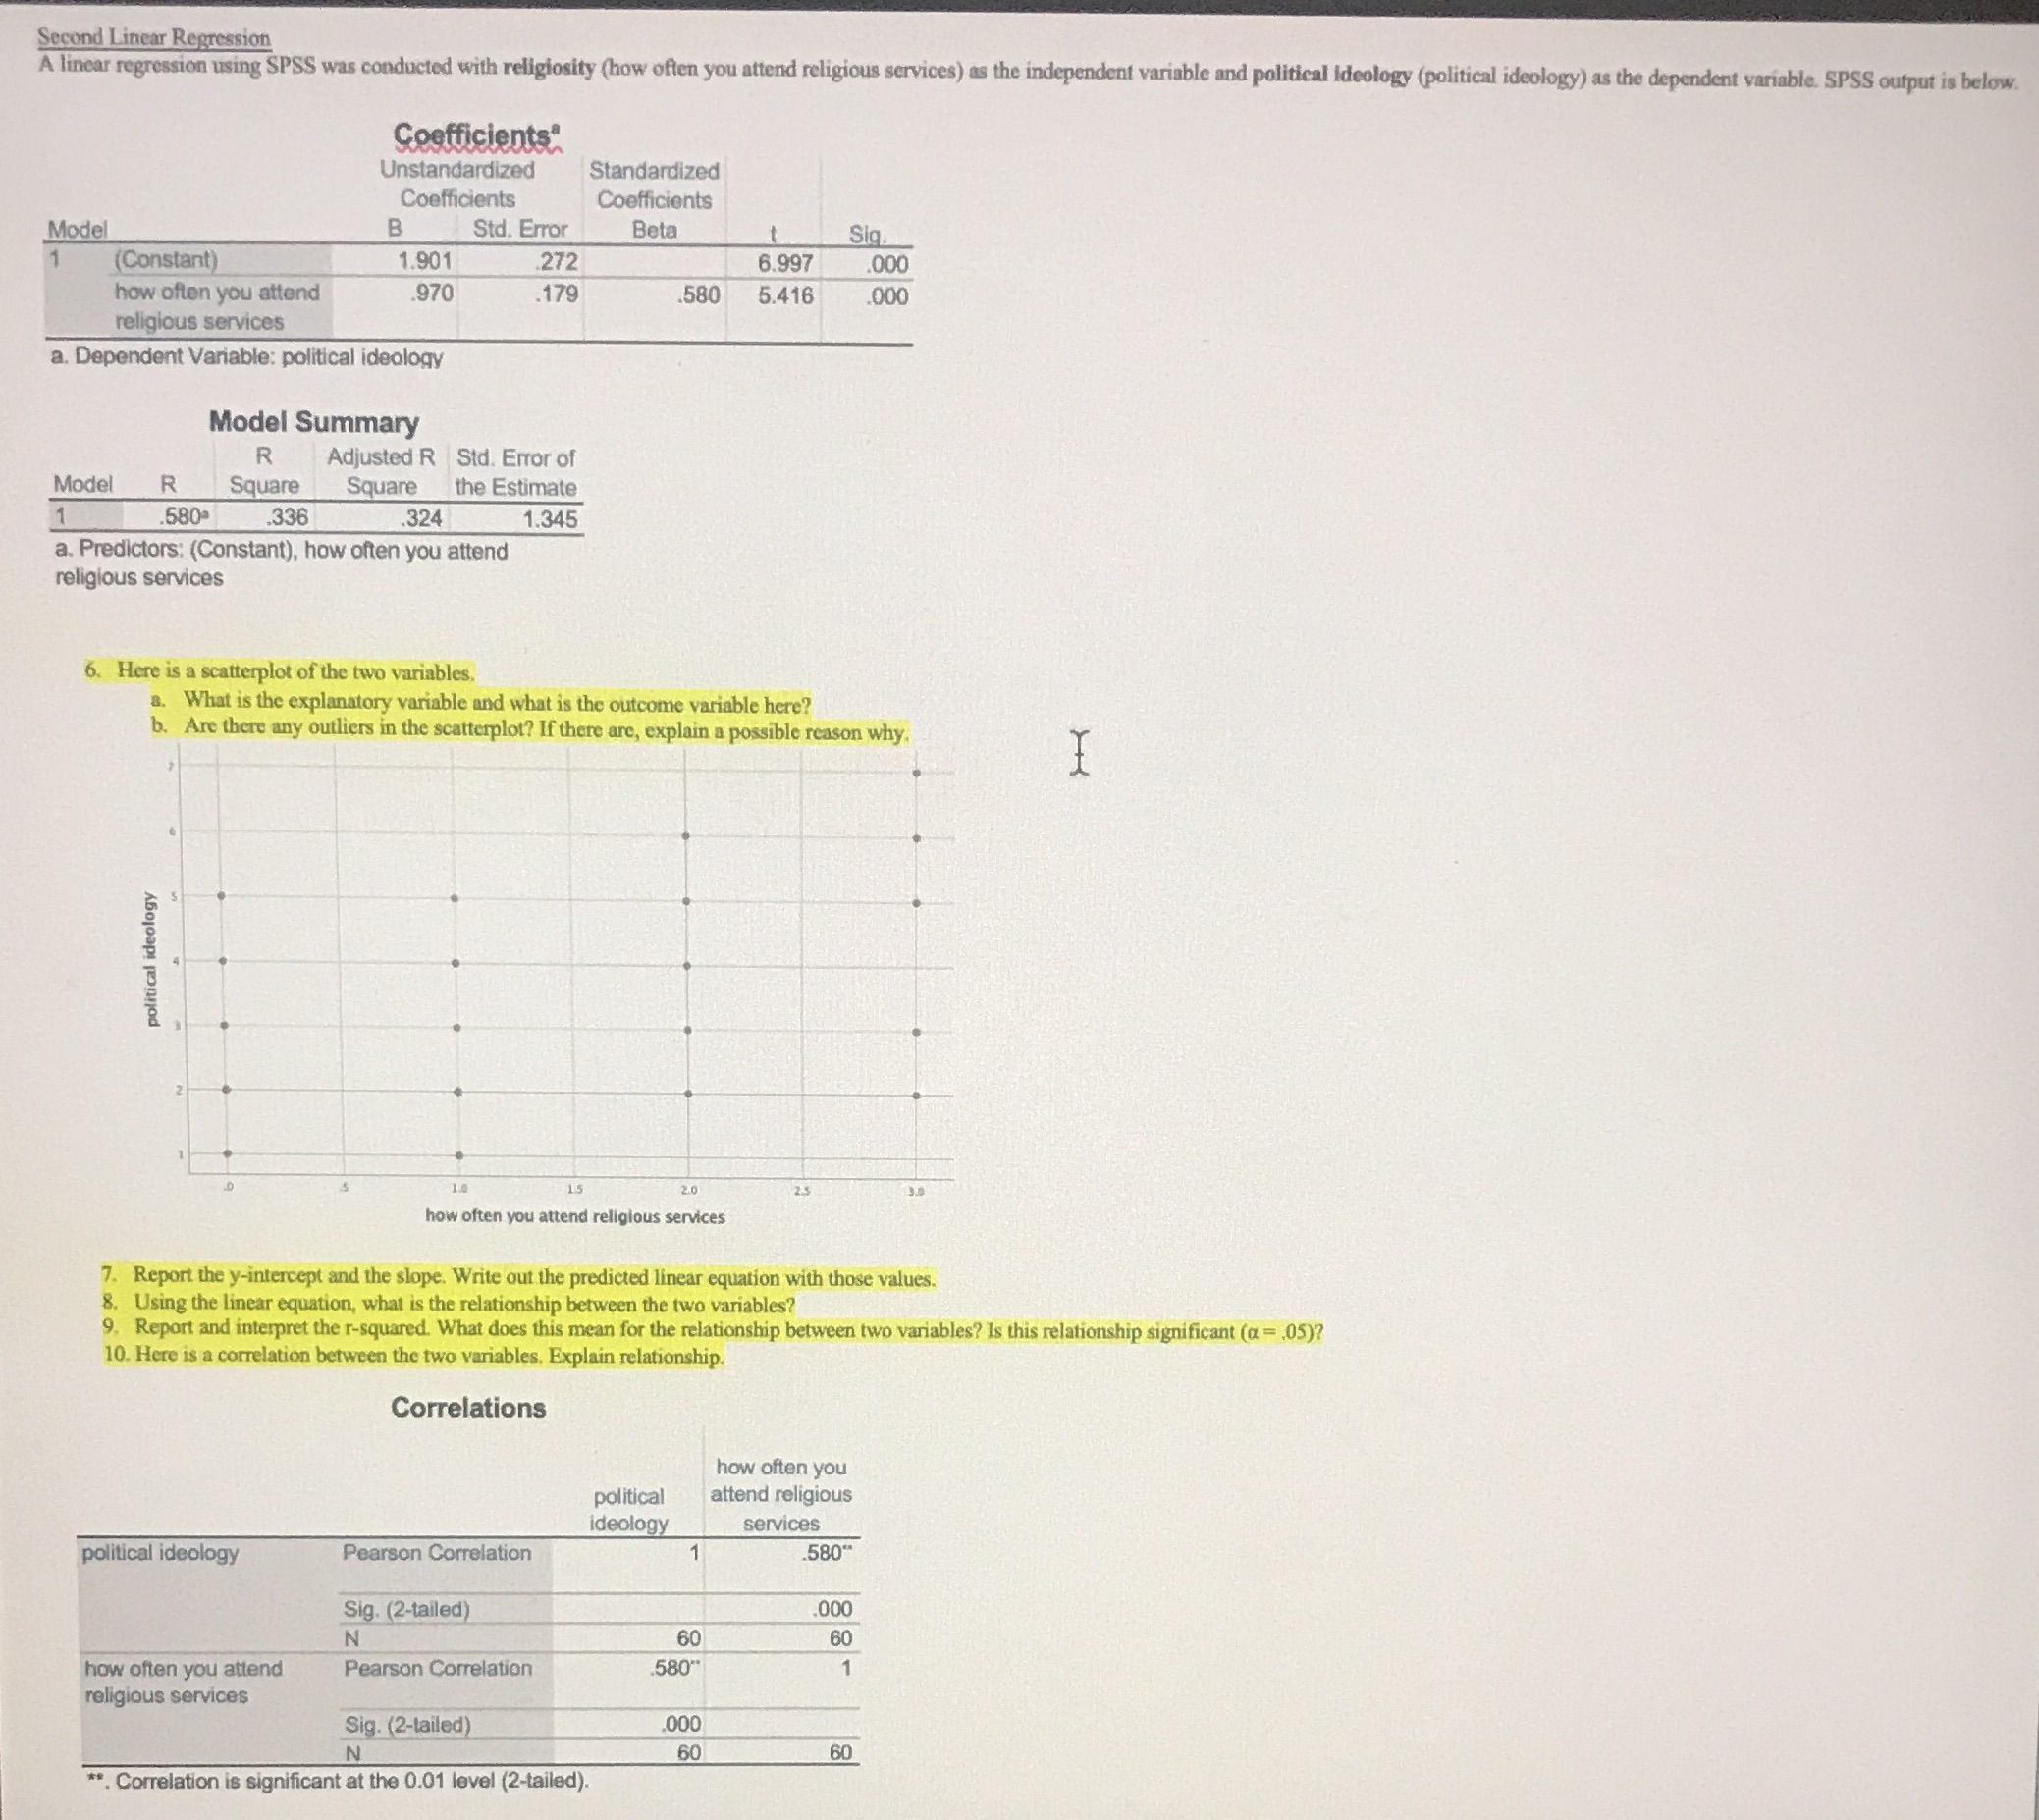
Second Linear Regression A linear regression using SPSS was conducted with religiosity (how often you attend religious services) as the independent variable and political ideology (political ideology) as the dependent variable. SPSS output is below. Coefficients" Unstandardized Standardized Coefficients Coefficients Model B Std. Error Beta Sig Constant) 1.901 .272 6.997 .000 how often you attend 970 .179 580 5.416 000 religious services a. Dependent Variable: political ideology Model Summary R Adjusted R Std. Error of Model R Square Square the Estimate .580 .336 .324 1.345 a. Predictors: (Constant), how often you attend religious services 6. Here is a scatterplot of the two variables. . What is the explanatory variable and what is the outcome variable here? 6. Are there any outliers in the scatterplot? If there are, explain a possible reason why political ideology how often you attend religious services 7. Report the y-intercept and the slope. Write out the predicted linear equation with those values. 8. Using the linear equation, what is the relationship between the two variables? 9. Report and interpret the r-squared. What does this mean for the relationship between two variables? Is this relationship significant (a = .05)? 10. Here is a correlation between the two variables. Explain relationship. Correlations how often you political attend religious deology services political ideology Pearson Correlation .580" Sig. (2-tailed) 000 N 60 60 how often you attend Pearson Correlation 580" religious services Sig. (2-tailed) 000 60 60 * Correlation is significant at the 0.01 level (2-tailed)
Step by Step Solution
There are 3 Steps involved in it

Get step-by-step solutions from verified subject matter experts