

Question: please help ASAP Earned run average (ERA) is defined for pitchers as the number of earned runs (ER) divided by innings pitched (IP), multiplied by
please help ASAP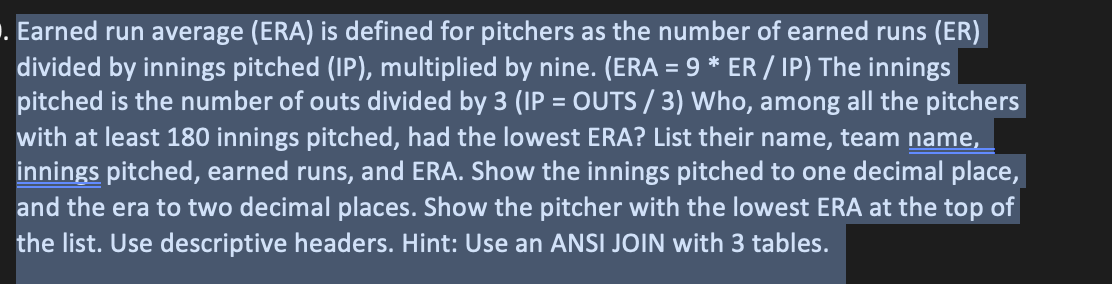
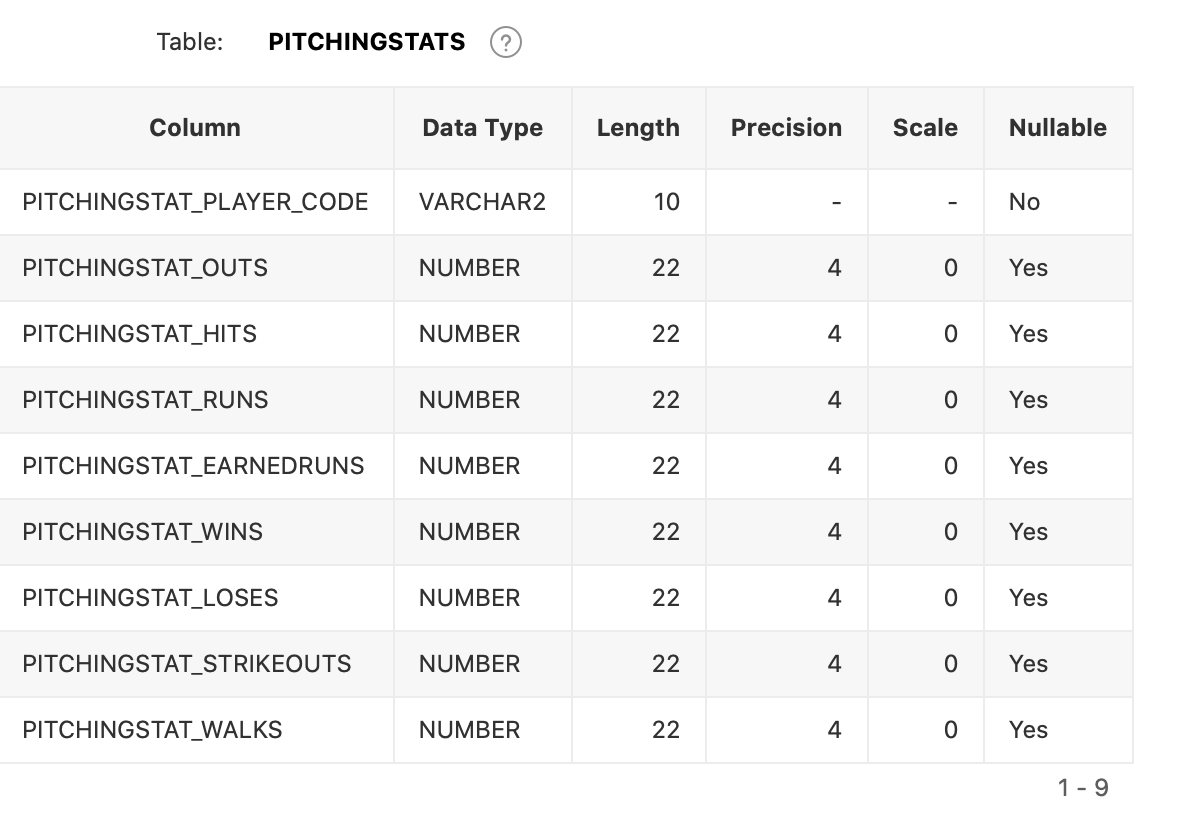
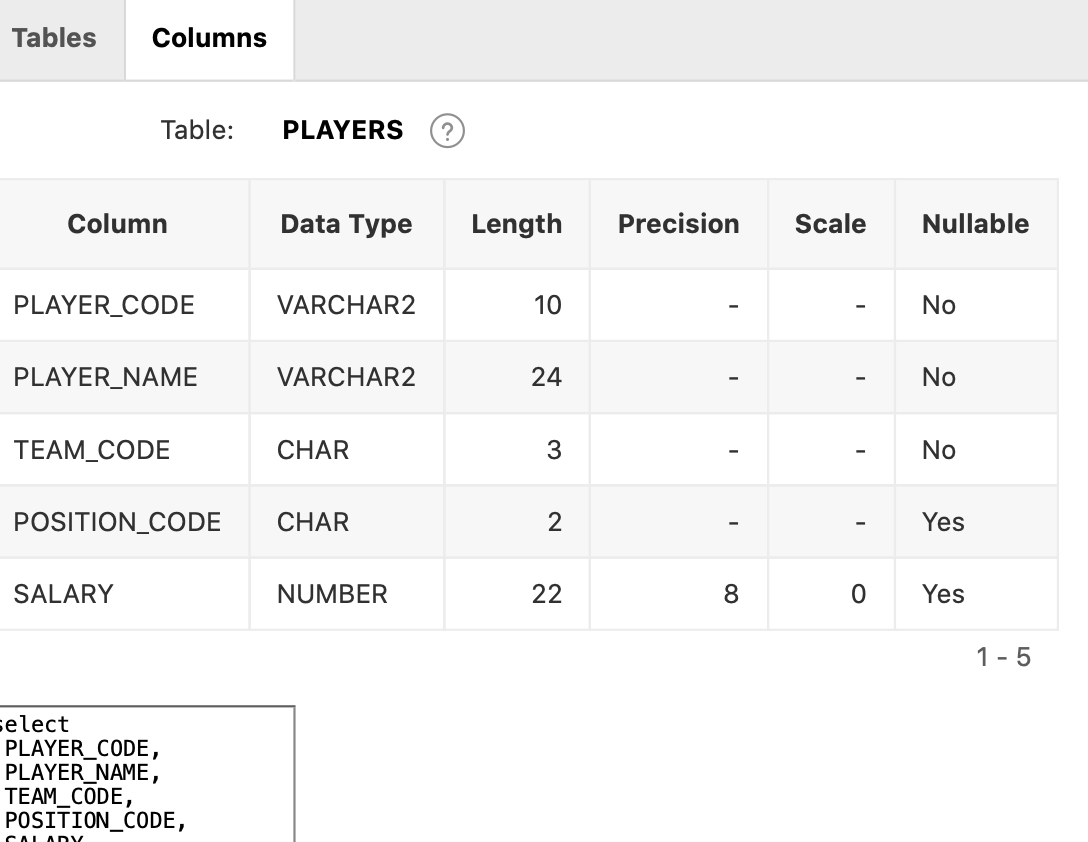
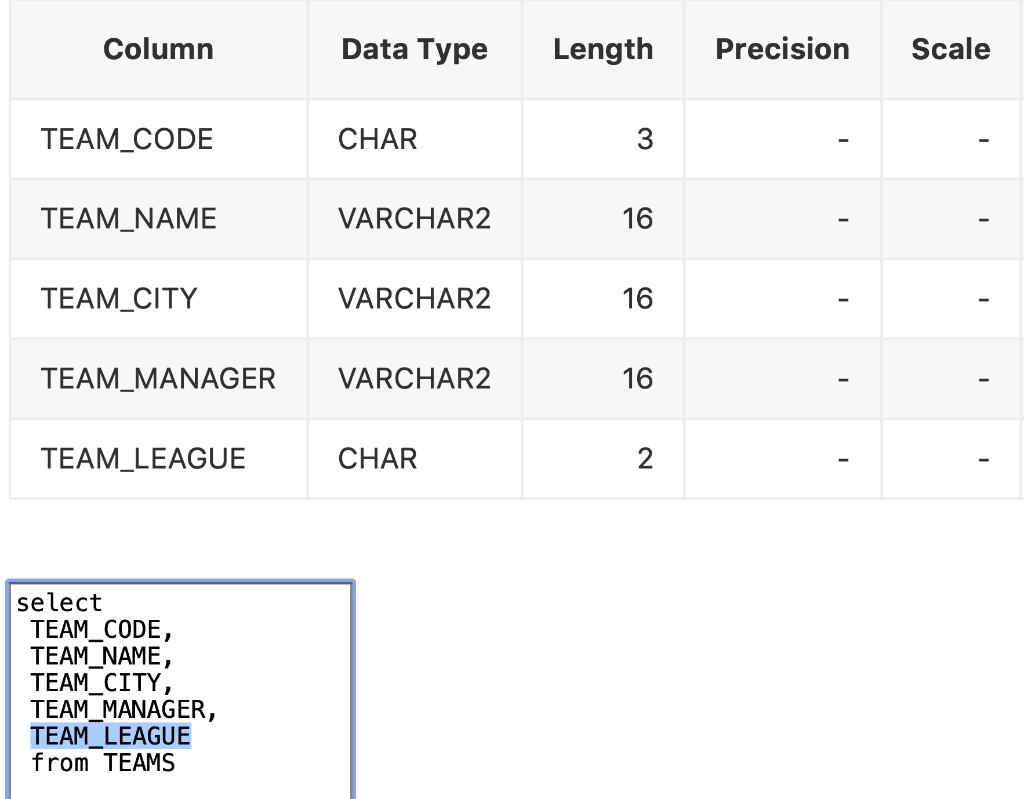

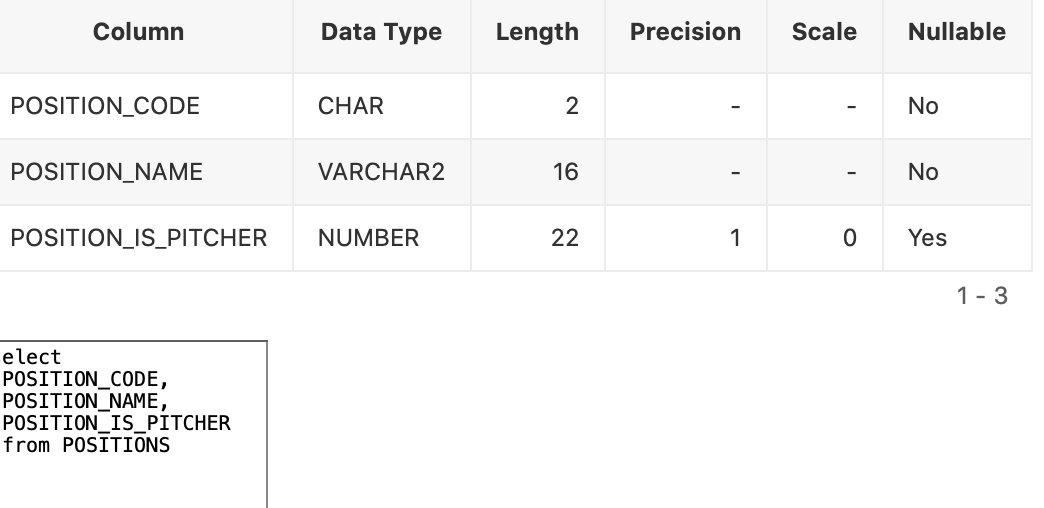
Earned run average (ERA) is defined for pitchers as the number of earned runs (ER) divided by innings pitched (IP), multiplied by nine. (ERA =9 ER / IP) The innings pitched is the number of outs divided by 3 (IP = OUTS / 3) Who, among all the pitchers with at least 180 innings pitched, had the lowest ERA? List their name, team name, innings pitched, earned runs, and ERA. Show the innings pitched to one decimal place, and the era to two decimal places. Show the pitcher with the lowest ERA at the top of the list. Use descriptive headers. Hint: Use an ANSI JOIN with 3 tables. Table: PITCHINGSTATS ? \begin{tabular}{|c|c|c|c|c|c|} \hline \multicolumn{1}{|c|}{ Column } & Data Type & Length & Precision & Scale & Nullable \\ \hline PITCHINGSTAT_PLAYER_CODE & VARCHAR2 & 10 & & & No \\ \hline PITCHINGSTAT_OUTS & NUMBER & 22 & 4 & 0 & Yes \\ \hline PITCHINGSTAT_HITS & NUMBER & 22 & 4 & 0 & Yes \\ \hline PITCHINGSTAT_RUNS & NUMBER & 22 & 4 & 0 & Yes \\ \hline PITCHINGSTAT_EARNEDRUNS & NUMBER & 22 & 4 & 0 & Yes \\ \hline PITCHINGSTAT_WINS & NUMBER & 22 & 4 & 0 & Yes \\ \hline PITCHINGSTAT_LOSES & NUMBER & 22 & 4 & 0 & Yes \\ \hline PITCHINGSTAT_STRIKEOUTS & NUMBER & 22 & 4 & 0 & Yes \\ \hline PITCHINGSTAT_WALKS & NUMBER & 22 & 4 & 0 & Yes \\ \hline \end{tabular} Tables Columns \begin{tabular}{|c|c|c|c|c|c|} \hline \multicolumn{1}{|c|}{ Table: } & PLAYERS \\ \hline Column & Data Type & Length & Precision & Scale & Nullable \\ \hline PLAYER_CODE & VARCHAR2 & 10 & & & No \\ \hline PLAYER_NAME & VARCHAR2 & 24 & & & No \\ \hline TEAM_CODE & CHAR & 3 & & & No \\ \hline POSITION_CODE & CHAR & 2 & & & Yes \\ \hline SALARY & NUMBER & 22 & 8 & 0 & Yes \\ \hline \end{tabular} \begin{tabular}{l} \hline Pect \\ PLAYERCODE, \\ PLAYER-NAME, \\ TEAM CODEE, \\ POSIIION_CODE, \\ POSINV \end{tabular} \begin{tabular}{|c|l|r|r|r|} \hline \multicolumn{1}{|c|}{ Column } & Data Type & Length & Precision & Scale \\ \hline TEAM_CODE & CHAR & 3 & & - \\ \hline TEAM_NAME & VARCHAR2 & 16 & & - \\ \hline TEAM_CITY & VARCHAR2 & 16 & & \\ \hline TEAM_MANAGER & VARCHAR2 & 16 & & \\ \hline TEAM_LEAGUE & CHAR & 2 & & \\ \hline \end{tabular} \begin{tabular}{|l|} \hline select \\ TEAM_CODE, \\ TEAM_NAME, \\ TEAM_CITY, \\ TEAM_MANAGER, \\ TEAM_LEAGUE \\ from TEAMS \end{tabular} 11. Which team had the lowest payroll? Show the team code and the payroll in the following format: $123,456,789 for each team. The team with lowest payroll should appear at the top of the result set. Use descriptive headers. Hint: Use GROUP BY. \begin{tabular}{l|l|l|l|l|l|l|} \hline \multicolumn{1}{|c|}{ Column } & Data Type & Length & Precision & Scale & Nullable \\ \hline POSITION_CODE & CHAR & 2 & & & No \\ \hline POSITION_NAME & VARCHAR2 & 16 & & & No \\ \hline POSITION_IS_PITCHER & NUMBER & 22 & 1 & 0 & Yes \\ \hline \end{tabular} Earned run average (ERA) is defined for pitchers as the number of earned runs (ER) divided by innings pitched (IP), multiplied by nine. (ERA =9 ER / IP) The innings pitched is the number of outs divided by 3 (IP = OUTS / 3) Who, among all the pitchers with at least 180 innings pitched, had the lowest ERA? List their name, team name, innings pitched, earned runs, and ERA. Show the innings pitched to one decimal place, and the era to two decimal places. Show the pitcher with the lowest ERA at the top of the list. Use descriptive headers. Hint: Use an ANSI JOIN with 3 tables. Table: PITCHINGSTATS ? \begin{tabular}{|c|c|c|c|c|c|} \hline \multicolumn{1}{|c|}{ Column } & Data Type & Length & Precision & Scale & Nullable \\ \hline PITCHINGSTAT_PLAYER_CODE & VARCHAR2 & 10 & & & No \\ \hline PITCHINGSTAT_OUTS & NUMBER & 22 & 4 & 0 & Yes \\ \hline PITCHINGSTAT_HITS & NUMBER & 22 & 4 & 0 & Yes \\ \hline PITCHINGSTAT_RUNS & NUMBER & 22 & 4 & 0 & Yes \\ \hline PITCHINGSTAT_EARNEDRUNS & NUMBER & 22 & 4 & 0 & Yes \\ \hline PITCHINGSTAT_WINS & NUMBER & 22 & 4 & 0 & Yes \\ \hline PITCHINGSTAT_LOSES & NUMBER & 22 & 4 & 0 & Yes \\ \hline PITCHINGSTAT_STRIKEOUTS & NUMBER & 22 & 4 & 0 & Yes \\ \hline PITCHINGSTAT_WALKS & NUMBER & 22 & 4 & 0 & Yes \\ \hline \end{tabular} Tables Columns \begin{tabular}{|c|c|c|c|c|c|} \hline \multicolumn{1}{|c|}{ Table: } & PLAYERS \\ \hline Column & Data Type & Length & Precision & Scale & Nullable \\ \hline PLAYER_CODE & VARCHAR2 & 10 & & & No \\ \hline PLAYER_NAME & VARCHAR2 & 24 & & & No \\ \hline TEAM_CODE & CHAR & 3 & & & No \\ \hline POSITION_CODE & CHAR & 2 & & & Yes \\ \hline SALARY & NUMBER & 22 & 8 & 0 & Yes \\ \hline \end{tabular} \begin{tabular}{l} \hline Pect \\ PLAYERCODE, \\ PLAYER-NAME, \\ TEAM CODEE, \\ POSIIION_CODE, \\ POSINV \end{tabular} \begin{tabular}{|c|l|r|r|r|} \hline \multicolumn{1}{|c|}{ Column } & Data Type & Length & Precision & Scale \\ \hline TEAM_CODE & CHAR & 3 & & - \\ \hline TEAM_NAME & VARCHAR2 & 16 & & - \\ \hline TEAM_CITY & VARCHAR2 & 16 & & \\ \hline TEAM_MANAGER & VARCHAR2 & 16 & & \\ \hline TEAM_LEAGUE & CHAR & 2 & & \\ \hline \end{tabular} \begin{tabular}{|l|} \hline select \\ TEAM_CODE, \\ TEAM_NAME, \\ TEAM_CITY, \\ TEAM_MANAGER, \\ TEAM_LEAGUE \\ from TEAMS \end{tabular} 11. Which team had the lowest payroll? Show the team code and the payroll in the following format: $123,456,789 for each team. The team with lowest payroll should appear at the top of the result set. Use descriptive headers. Hint: Use GROUP BY. \begin{tabular}{l|l|l|l|l|l|l|} \hline \multicolumn{1}{|c|}{ Column } & Data Type & Length & Precision & Scale & Nullable \\ \hline POSITION_CODE & CHAR & 2 & & & No \\ \hline POSITION_NAME & VARCHAR2 & 16 & & & No \\ \hline POSITION_IS_PITCHER & NUMBER & 22 & 1 & 0 & Yes \\ \hline \end{tabular}
Step by Step Solution
There are 3 Steps involved in it

Get step-by-step solutions from verified subject matter experts