

Question: Please help ASAP! fA. What does the scatter plot show? B. We could apply a piecewise linear model for this data with a knot of

Please help ASAP!
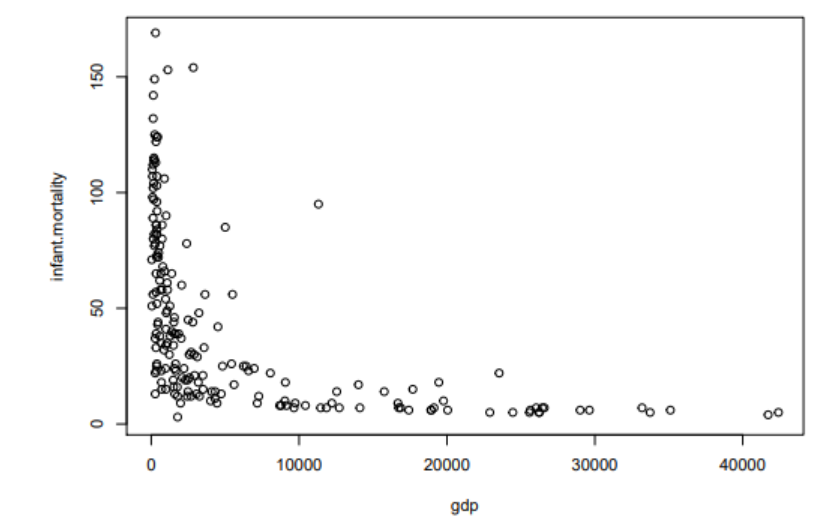
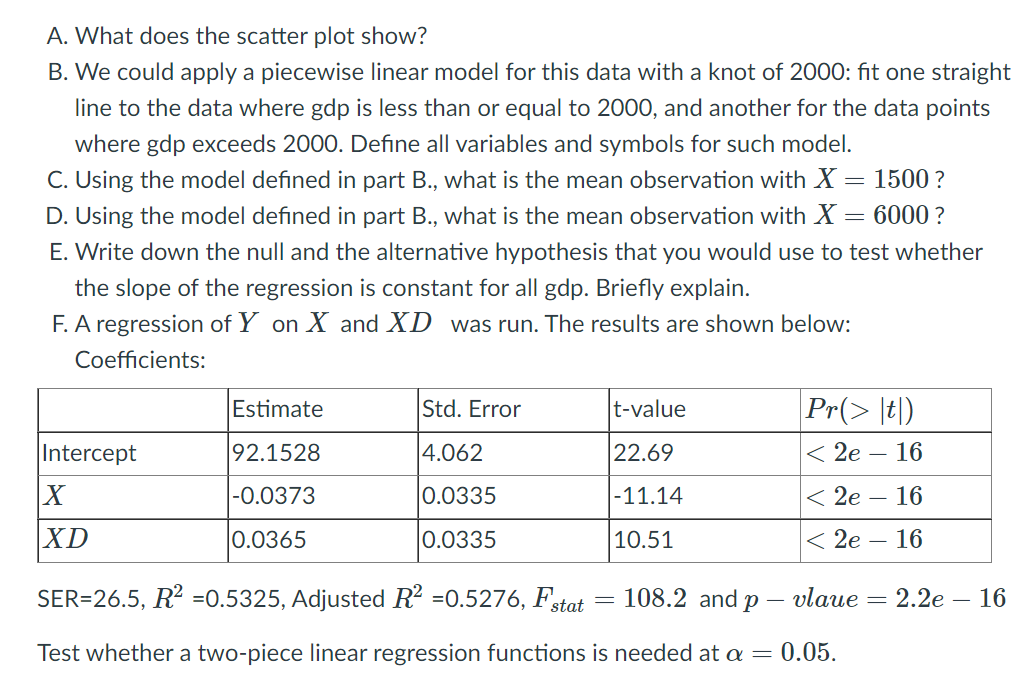
\fA. What does the scatter plot show? B. We could apply a piecewise linear model for this data with a knot of 2000: fit one straight line to the data where gap is less than or equal to 2000, and another for the data points where gap exceeds 2000. Define all variables and symbols for such model. C. Using the model defined in part B., what is the mean observation with X = 1500? D. Using the model defined in part B., what is the mean observation with X = 6000 ? E. Write down the null and the alternative hypothesis that you would use to test whether the slope of the regression is constant for all gdp. Briefly explain. F. A regression of Y on X and XD was run. The results are shown below: Coefficients: Estimate Std. Error t-value Pr ( > It1) Intercept 92.1528 4.062 22.69
Step by Step Solution
There are 3 Steps involved in it

Get step-by-step solutions from verified subject matter experts