

Question: PLEASE HELP! ASAP! US Census Bureau released the monthly retail values of different industries from January 1992 to August 2019. The retail file includes the
PLEASE HELP! ASAP!
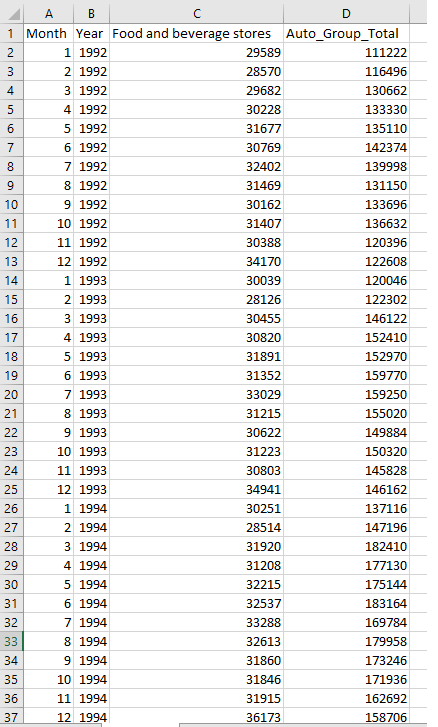
US Census Bureau released the monthly retail values of different industries from January 1992 to August 2019. The retail file includes the details. Sales of two groups of retailers are aggregated:
Auto_Group_Total is the sum of monthly sales for motor vehicles and parts dealers, automotive and other motor vehicle dealers, automobile dealers, new car dealers, used car dealers, automotive parts, acc. And tire dealers.
Food and Beverage Stores is the sum of a monthly sales for food and beverage stores.
Do a Levene test to determine if the variances of the monthly sales of Auto_Group_Total for the first 4 months of the year (January through April every year) are significantly different. What is the P-Value of this test?
Group of answer choices
Between 0.01 and 0.05
0.2 or more, but less than 0.3
Less than or equal to 0.01
0.3 or more, but less than 0.4
0.4 or more
0.05 or more but less than 0.2
Question 12
Use Retail file. Do an ANOVA test to determine if the average monthly sales of the first four months of the year (January through April every year) for Auto_Group_Total are significantly different. Use 0.05 significance level.
Group of answer choices
The P-value of this test is less than 0.01. This is the evidence of significant difference among the means
The P-value of this test is between 0.01 and 0.05. This is the evidence of significant difference among the means
The P-value of this test is less than 0.01. This is not an evidence of significant difference among the means
The P-value of this test is between 0.01 and 0.05. This is not an evidence of significant difference among the means
The P-value of this test is more than 0.05. This is not an evidence of significant difference among the means
The P-value of this test is more than 0.05. This is the evidence of significant difference among the means
Question 13
Use Retail file. Do a Levene test to determine if the variances of the monthly sales of Food and Beverage Stores for the first 6 months of the year (January through June every year) are significantly different. What is the P-Value of this test?
Group of answer choices
0.05 or more but less than 0.2
0.4 or more
0.3 or more, but less than 0.4
Less than or equal to 0.01
0.2 or more, but less than 0.3
Between 0.01 and 0.05
Question 14
Use Retail file. Do an ANOVA test to determine if the average monthly sales of the first 6 months of the year (January through June every year) for Food and Beverage Stores are significantly different. Use 0.05 significance level.
Group of answer choices
The P-value of this test is less than 0.01. This is not an evidence of significant difference among the means
The P-value of this test is between 0.01 and 0.05. This is not an evidence of significant difference among the means
The P-value of this test is more than 0.05. This is the evidence of significant difference among the means
The P-value of this test is more than 0.05. This is not an evidence of significant difference among the means
The P-value of this test is between 0.01 and 0.05. This is the evidence of significant difference among the means
The P-value of this test is less than 0.01. This is the evidence of significant difference among the means
Question 15
Use Retail file. Do a Kruskal-Wallis test for the first 6 months of the year (January through June every year) for Food and Beverage Stores sales. What is the calculated H value of this test?
Group of answer choices
More than 9
Between 3 and 5
Between 1 and 3
Between 7 and 9
Between 5 and 7
Step by Step Solution
There are 3 Steps involved in it

Get step-by-step solutions from verified subject matter experts