

Question: Please help. (b) Does the ordinary straight line regression model (3.7) seem to t the data well? If not, carefully describe how the model can

Please help.

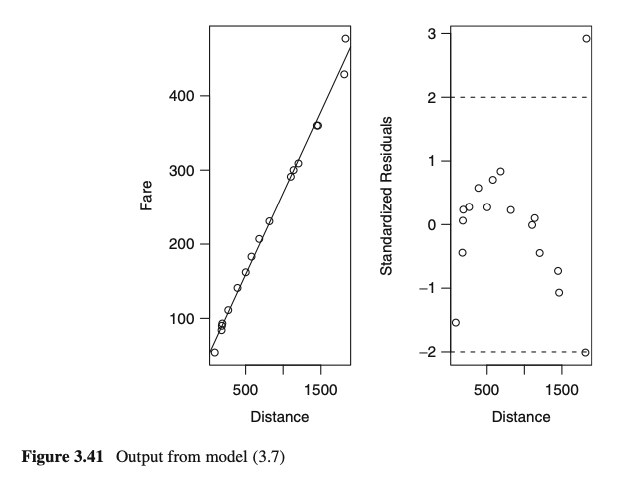
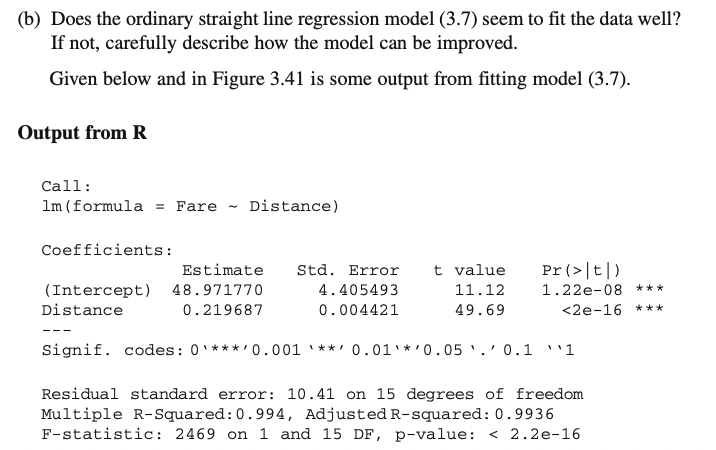
(b) Does the ordinary straight line regression model (3.7) seem to t the data well? If not, carefully describe how the model can be improved. Given below and in Figure 3.41 is some output from tting model (3.7). Output from R Call: lm(formula = Fare ~ Distance} Coefficients: Estimate Std. Error t value Pr(}|t|} (Intercept) 43.971770 4.405493 11.12 1.22e08 *** Distance 0.219587 0.004421 49.59 {26316 *** Signif. codes: 0'***'0.001 '**' 0.01'*'0.05 '.' 0.1 \"1 Residual standard error: 10.41 on 15 degrees of freedom Multiple RSquared:0.994, Adjustedrsquared:0.9936 Fstatistic: 2469 on 1 and 15 DF, pvalue:
Step by Step Solution
There are 3 Steps involved in it
1 Expert Approved Answer
Step: 1 Unlock

Question Has Been Solved by an Expert!
Get step-by-step solutions from verified subject matter experts
Step: 2 Unlock
Step: 3 Unlock