

Question: please help!! begin{tabular}{|l||l|l|} hline Step & Instructions hline & RewardsCoupon & The customer reccives both discounts (i.e., Rewards ID is not equal to N/A
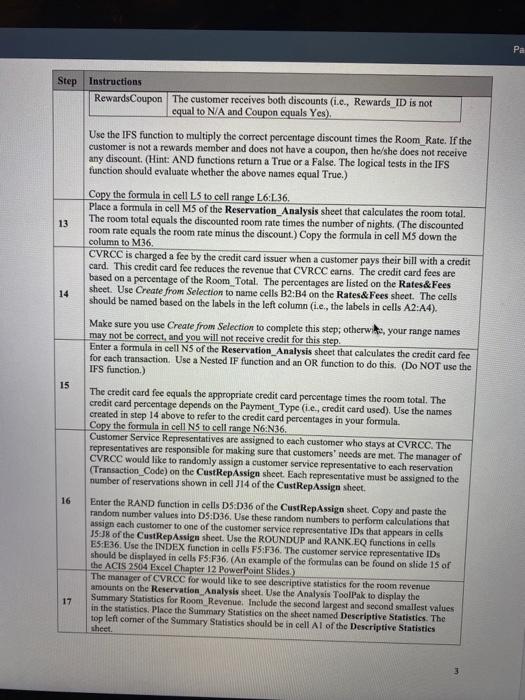
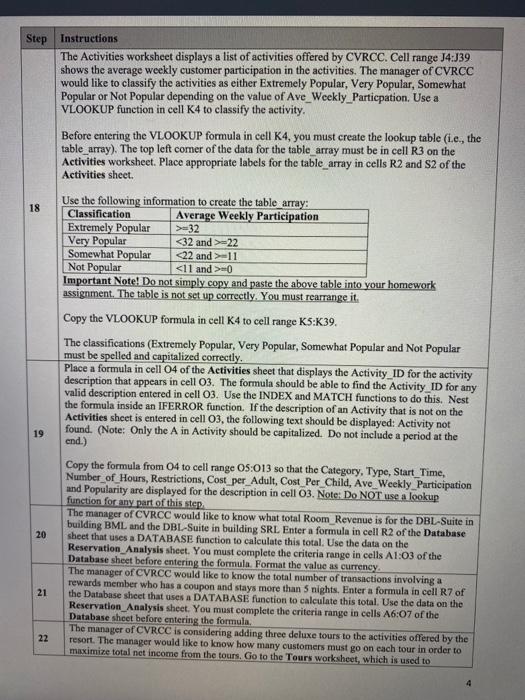
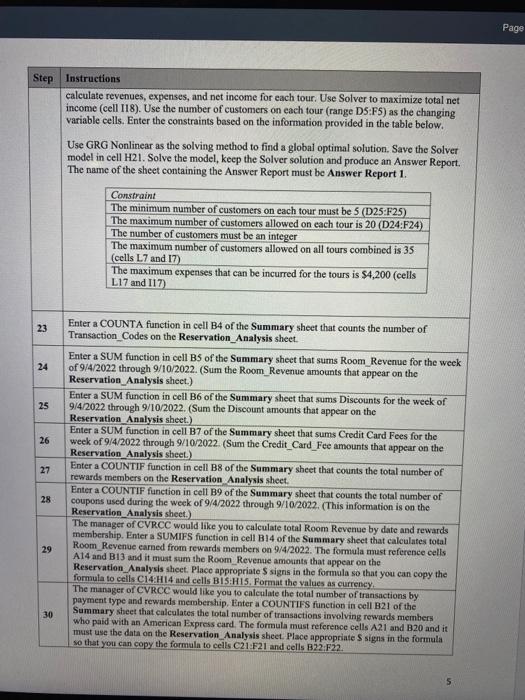
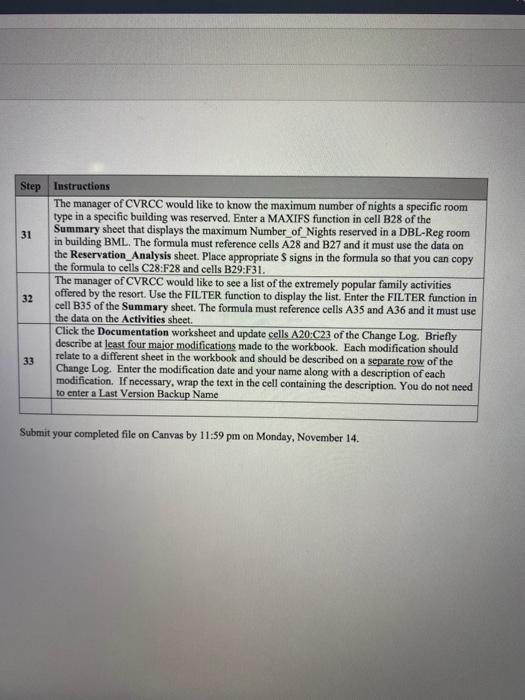
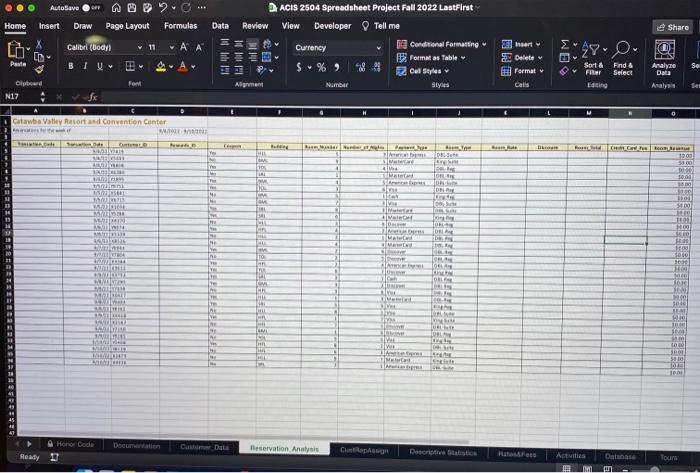
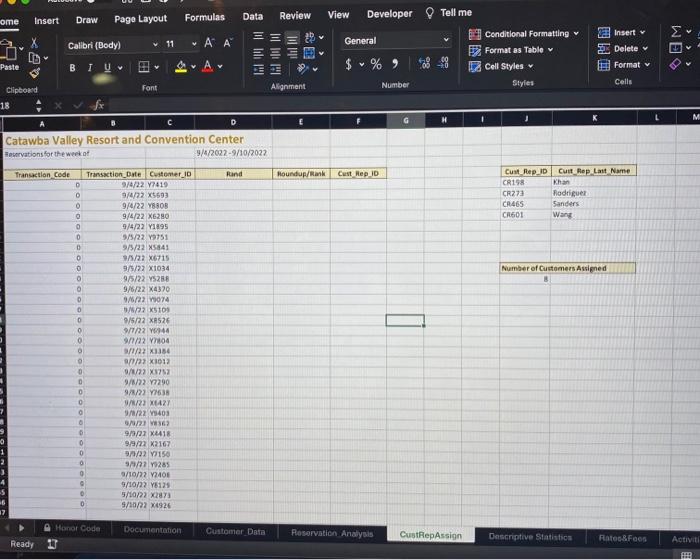
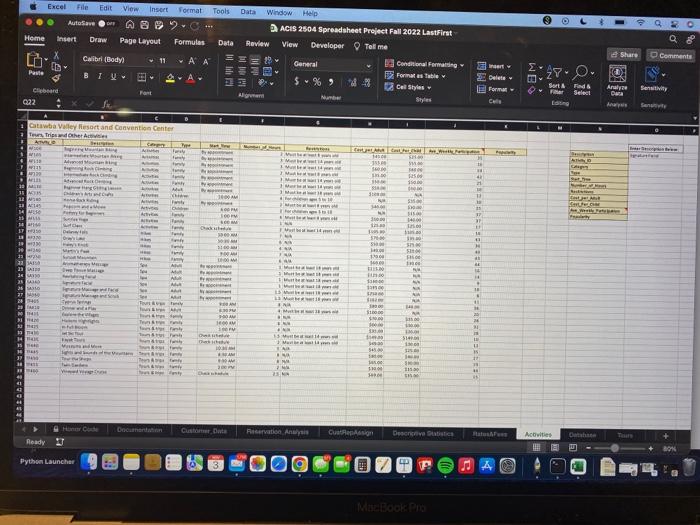
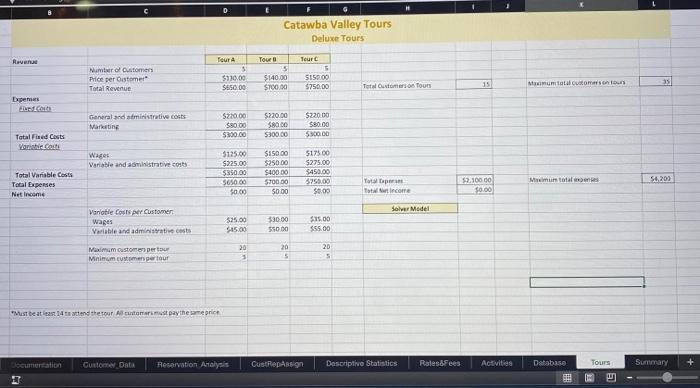
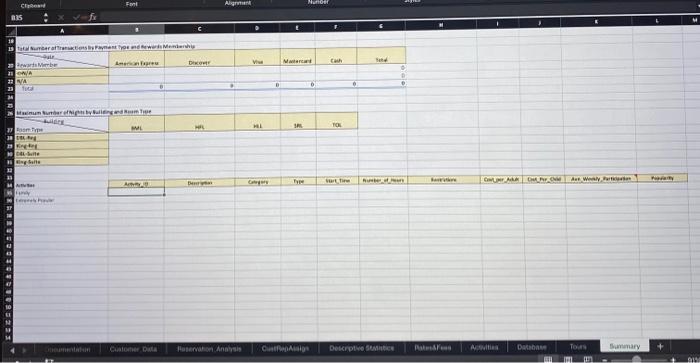
\begin{tabular}{|l||l|l|} \hline Step & Instructions \\ \hline & RewardsCoupon & The customer reccives both discounts (i.e., Rewards ID is not equal to N/A and Coupon equals Yes). \\ \hline \end{tabular} Use the IFS function to multiply the correct percentage discount times the Room_Rate. If the customer is not a rewards member and does not have a coupon, then he/she does not receive any discount. (Hint: AND functions retum a True or a False. The logical tests in the IFS function should evaluate whether the above names equal True.) 16 Enter the RAND function in cells D5:D36 of the CustRepAssign sheet. Copy and paste the random number values into DS:D36. Use these random numbers to perform calculations that assign each customer to one of the customer service representative IDs that appears in cells J5:18 of the CustRepAssign sheet. Use the ROUNDUP and RANK.EQ functions in cells ES:E36. Use the INDEX function in cells FS:F36. The customer service representative IDs should be displayed in cells F5.F36. (An example of the formulas can be found on slide 15 of the ACIS 2504 Excel Chapter 12 PowerPoint Slides) The manager of CVRCC for would like to see descriptive statistics for the room revenue amounts on the Reservation_Analysis sheet. Use the Analysis ToolRak to display the Summary Statistics for Room_Revenue. Include the second largest and second smallest values in the statistics. Place the Summary Statistics on the shoet named Descriptive Statistics. The top left theet. 17 theet 3 \begin{tabular}{l|l} Step & Instructions \\ \hline & The Activities worksheet displays a list of activities offered by CVRCC. Cell range J4:J39 \end{tabular} shows the average weekly customer participation in the activities. The manager of CVRCC would like to classify the activities as either Extremely Popular, Very Popular, Somewhat Popular or Not Popular depending on the value of Ave_Weekly_Particpation. Use a VLOOKUP function in cell K4 to classify the activity. Before entering the VLOOKUP formula in cell K4, you must create the lookup table (i.e., the table_array). The top left comer of the data for the table_array must be in cell R3 on the Activities worksheet. Place appropriate labels for the table_array in cells R2 and S2 of the Activities sheet. Use the following information to create the table arrav: Instructions calculate revenues, expenses, and net income for each tour. Use Solver to maximize total net income (cell I18). Use the number of customers on each tour (range D5:F5) as the changing variable cells. Enter the constraints based on the information provided in the table below. Use GRG Nonlinear as the solving method to find a global optimal solution. Save the Solver model in cell H21. Solve the model, keep the Solver solution and produce an Answer Report. The name of the sheet containing the Answer Report must be Answer Report 1. Submit your completed file on Canvas by 11:59 pm on Monday, November 14. Eatawba Valley Reson and Convention Center Weekly Reservation Report and Activitv List ome Insert Draw Page Layout Formulas Data Review View Developer \$ Tellme Catawba Valley Resort and Convention Center 7etaryations for the werkat 9/4/20229/10/2022 Clipboard Font E5 fx \begin{tabular}{|l||l|l|} \hline Step & Instructions \\ \hline & RewardsCoupon & The customer reccives both discounts (i.e., Rewards ID is not equal to N/A and Coupon equals Yes). \\ \hline \end{tabular} Use the IFS function to multiply the correct percentage discount times the Room_Rate. If the customer is not a rewards member and does not have a coupon, then he/she does not receive any discount. (Hint: AND functions retum a True or a False. The logical tests in the IFS function should evaluate whether the above names equal True.) 16 Enter the RAND function in cells D5:D36 of the CustRepAssign sheet. Copy and paste the random number values into DS:D36. Use these random numbers to perform calculations that assign each customer to one of the customer service representative IDs that appears in cells J5:18 of the CustRepAssign sheet. Use the ROUNDUP and RANK.EQ functions in cells ES:E36. Use the INDEX function in cells FS:F36. The customer service representative IDs should be displayed in cells F5.F36. (An example of the formulas can be found on slide 15 of the ACIS 2504 Excel Chapter 12 PowerPoint Slides) The manager of CVRCC for would like to see descriptive statistics for the room revenue amounts on the Reservation_Analysis sheet. Use the Analysis ToolRak to display the Summary Statistics for Room_Revenue. Include the second largest and second smallest values in the statistics. Place the Summary Statistics on the shoet named Descriptive Statistics. The top left theet. 17 theet 3 \begin{tabular}{l|l} Step & Instructions \\ \hline & The Activities worksheet displays a list of activities offered by CVRCC. Cell range J4:J39 \end{tabular} shows the average weekly customer participation in the activities. The manager of CVRCC would like to classify the activities as either Extremely Popular, Very Popular, Somewhat Popular or Not Popular depending on the value of Ave_Weekly_Particpation. Use a VLOOKUP function in cell K4 to classify the activity. Before entering the VLOOKUP formula in cell K4, you must create the lookup table (i.e., the table_array). The top left comer of the data for the table_array must be in cell R3 on the Activities worksheet. Place appropriate labels for the table_array in cells R2 and S2 of the Activities sheet. Use the following information to create the table arrav: Instructions calculate revenues, expenses, and net income for each tour. Use Solver to maximize total net income (cell I18). Use the number of customers on each tour (range D5:F5) as the changing variable cells. Enter the constraints based on the information provided in the table below. Use GRG Nonlinear as the solving method to find a global optimal solution. Save the Solver model in cell H21. Solve the model, keep the Solver solution and produce an Answer Report. The name of the sheet containing the Answer Report must be Answer Report 1. Submit your completed file on Canvas by 11:59 pm on Monday, November 14. Eatawba Valley Reson and Convention Center Weekly Reservation Report and Activitv List ome Insert Draw Page Layout Formulas Data Review View Developer \$ Tellme Catawba Valley Resort and Convention Center 7etaryations for the werkat 9/4/20229/10/2022 Clipboard Font E5 fx
Step by Step Solution
There are 3 Steps involved in it

Get step-by-step solutions from verified subject matter experts