

Question: Please help by answering the question below with the sub questions. Please fill out the tables and explain! 17. For each of the supply &
Please help by answering the question below with the sub questions. Please fill out the tables and explain!
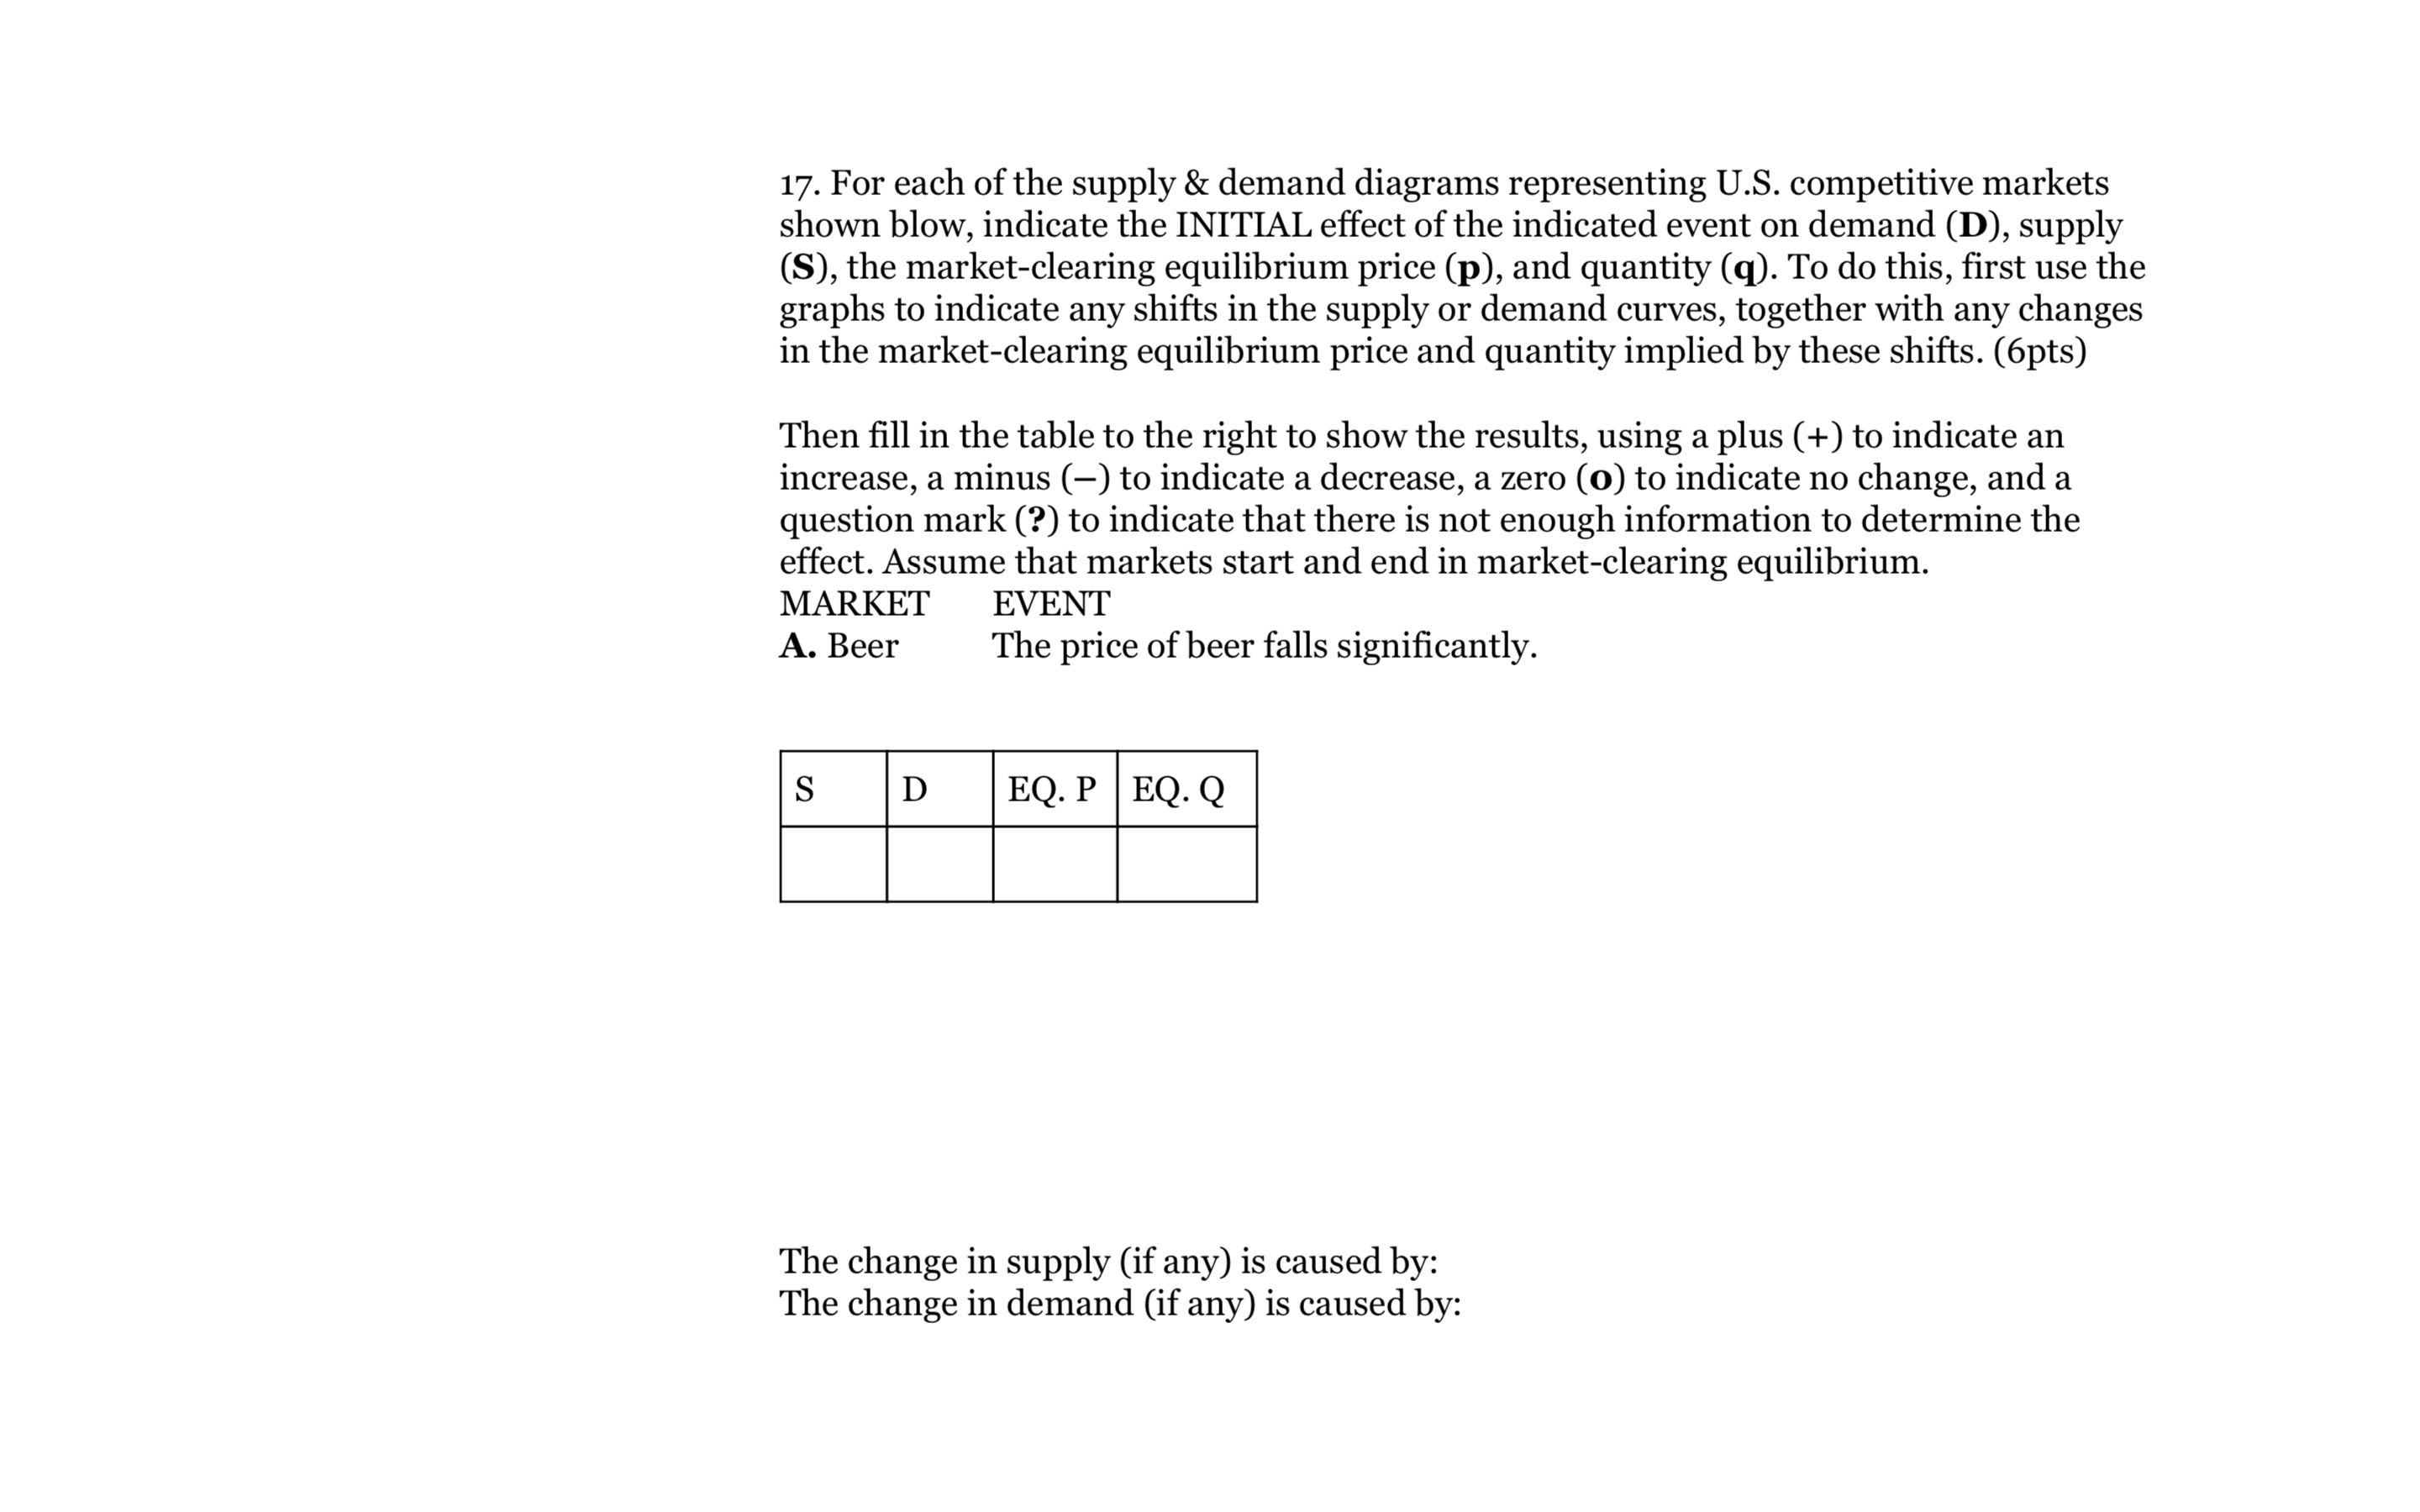
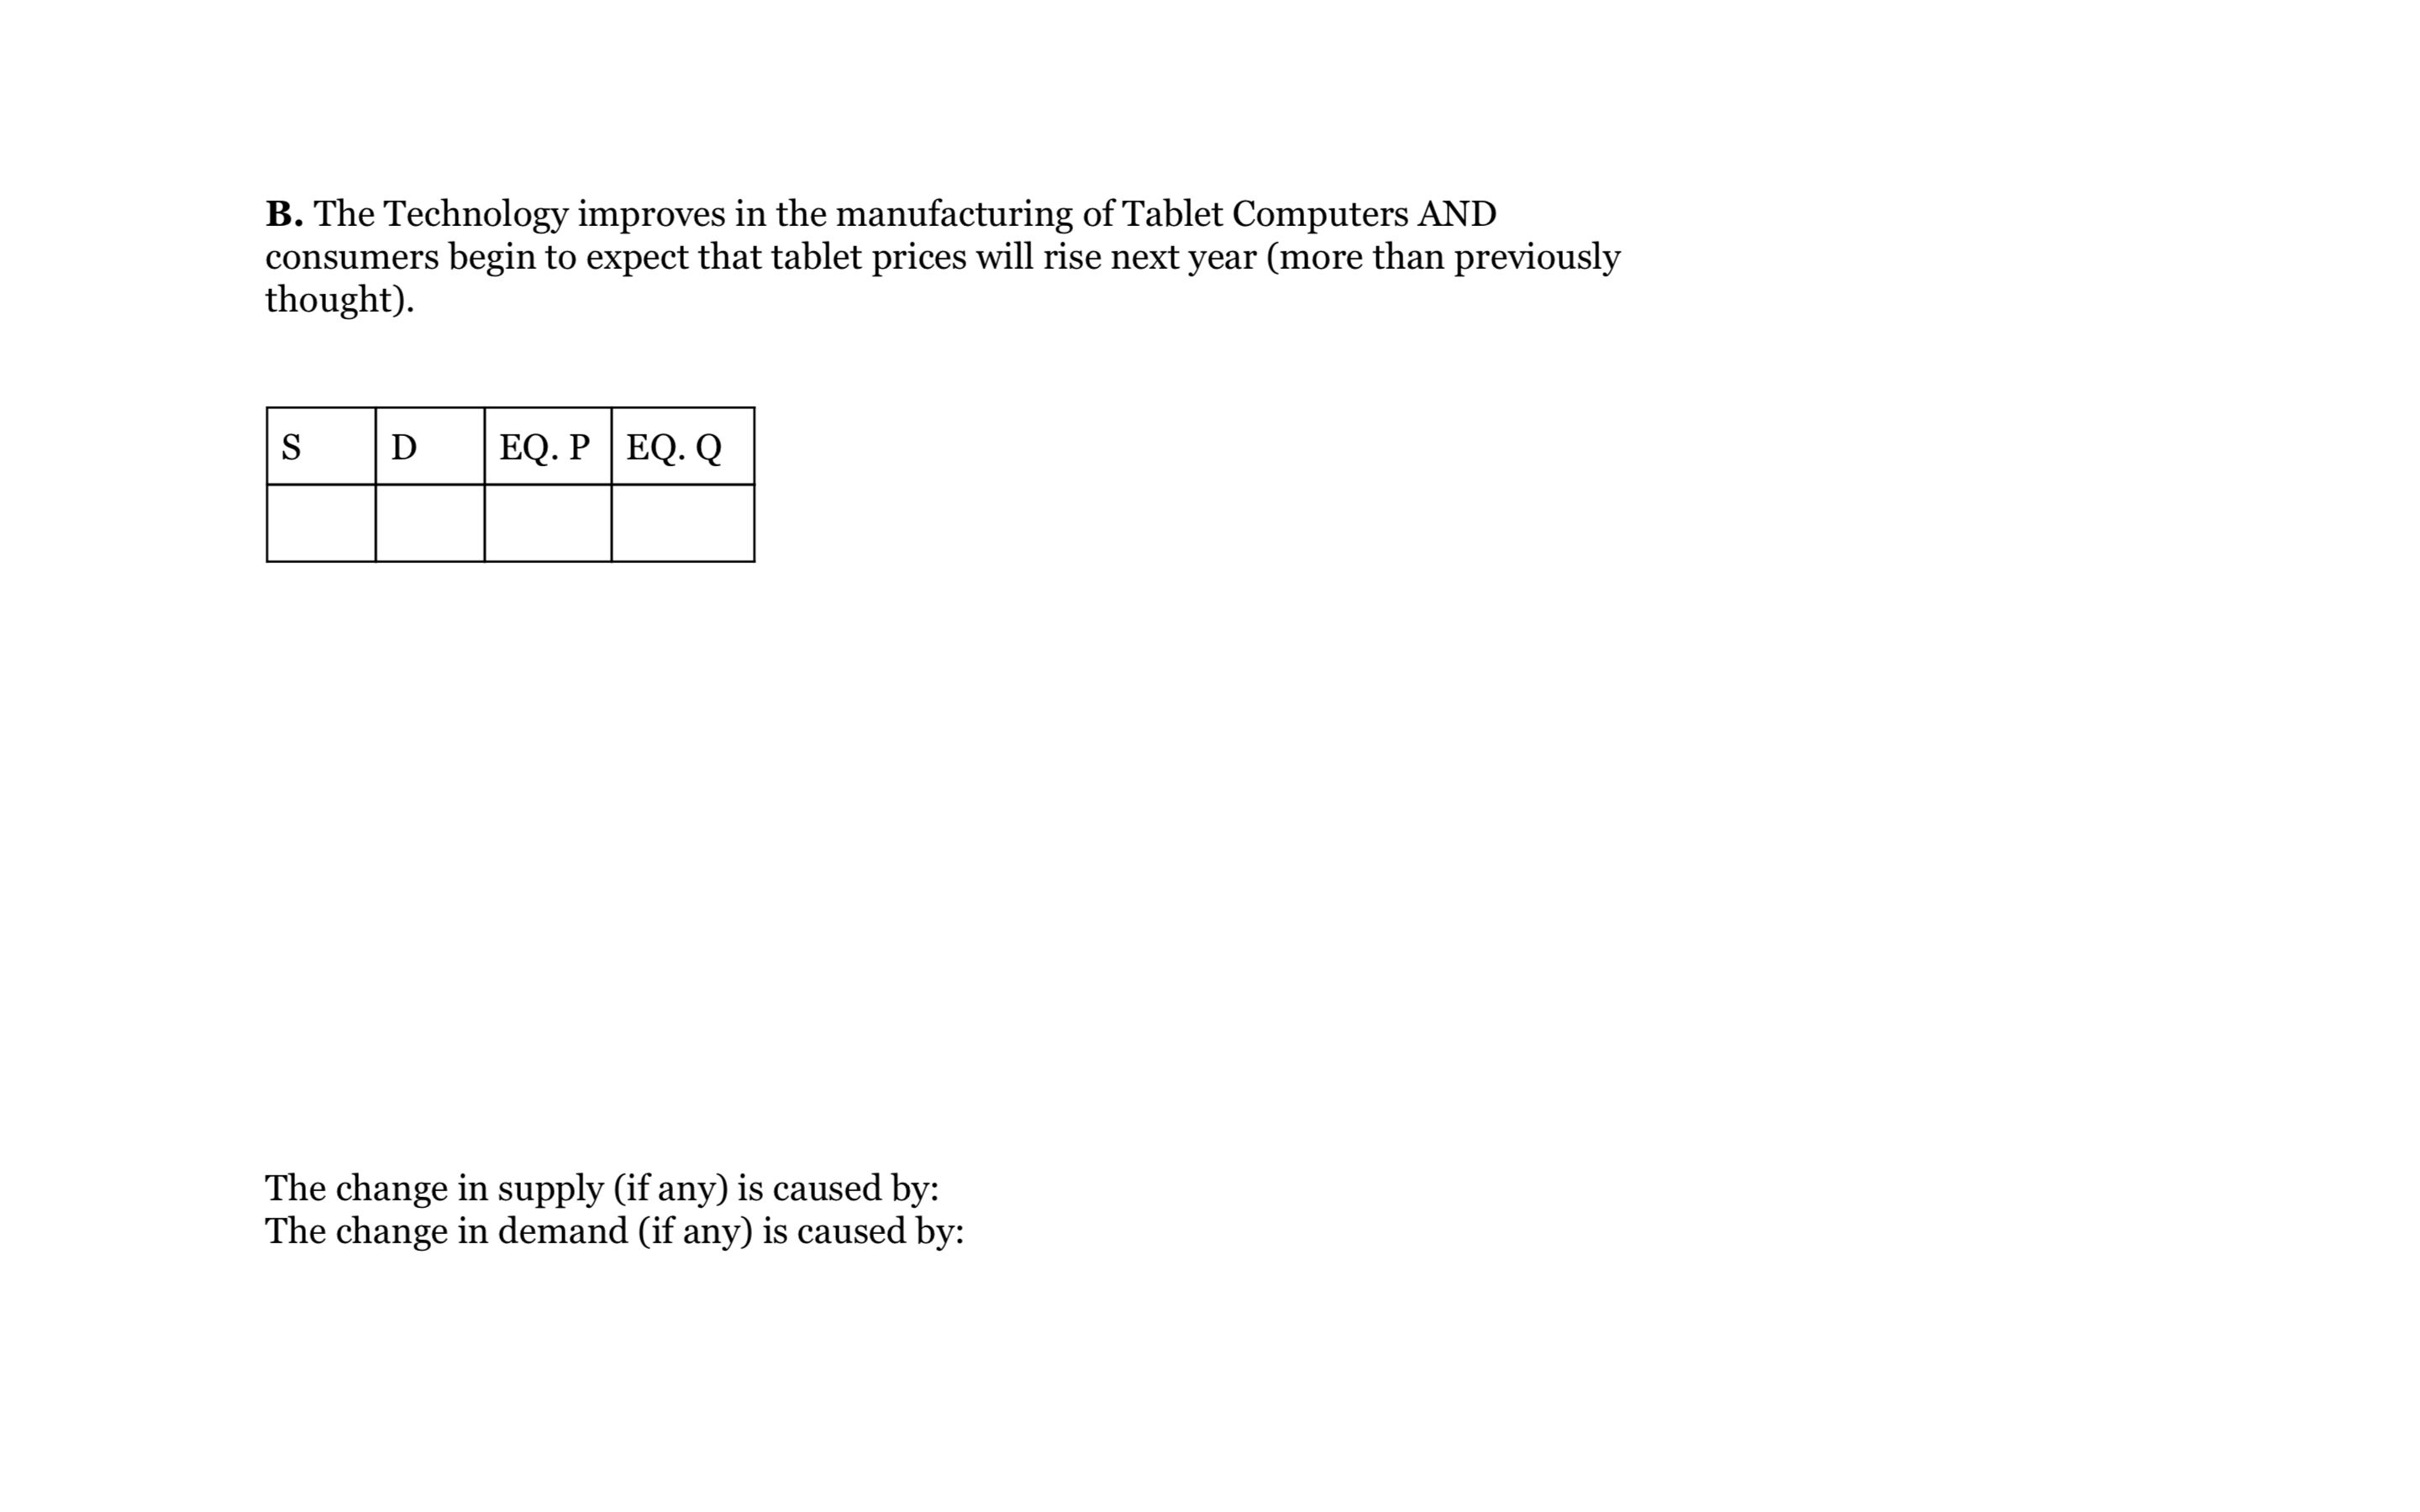
17. For each of the supply & demand diagrams representing U.S. competitive markets shown blow, indicate the INITIAL effect of the indicated event on demand (D), supply (S), the marketclearing equilibrium price (p), and quantity (q). To do this, rst use the graphs to indicate any shifts in the supply or demand curves, together with any changes in the market-clearing equilibrium price and quantity implied by these shifts. (6pts) Then ll in the table to the right to show the results, using a plus (+) to indicate an increase, a minus () to indicate a decrease, a zero (0) to indicate no change, and a question mark (?) to indicate that there is not enough information to determine the effect. Assume that markets start and end in market-clearing equilibrium. MARKET EVENT A. Beer The price of beer falls signicantly. nil-- The change in supply (if any) is caused by: The change in demand (if any) is caused by: B. The Technology improves in the manufacturing of Tablet Computers AND consumers begin to expect that tablet prices will rise next year (more than previously thought). Iii-- The change in supply (if any) is caused by: The change in demand (if any) is caused by
Step by Step Solution
There are 3 Steps involved in it

Get step-by-step solutions from verified subject matter experts