

Question: Please help by explaining how to fill out the chart. When explaining, put everything into chart form like above. Please and thank you. Exercise 23-16
 Please help by explaining how to fill out the chart. When explaining, put everything into chart form like above. Please and thank you.
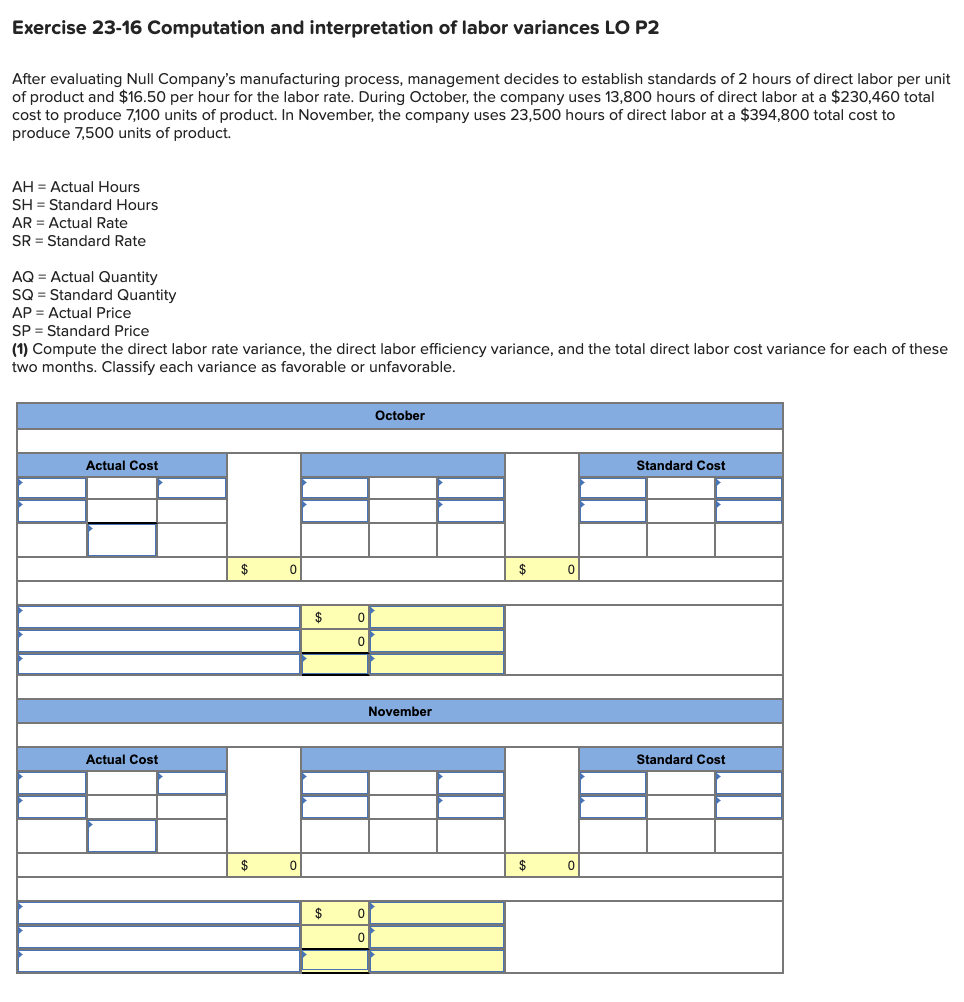
Exercise 23-16 Computation and interpretation of labor variances LO P2 After evaluating Null Company's manufacturing process, management decides to establish standards of 2 hours of direct labor per unit of product and $16.50 per hour for the labor rate. During October, the company uses 13,800 hours of direct labor at a $230,460 total cost to produce 7,100 units of product. In November, the company uses 23,500 hours of direct labor at a $394,800 total cost to produce 7,500 units of product. AH = Actual Hours SH = Standard Hours AR = Actual Rate SR = Standard Rate AQ = Actual Quantity SQ = Standard Quantity AP = Actual Price SP = Standard Price (1) Compute the direct labor rate variance, the direct labor efficiency variance, and the total direct labor cost variance for each of these two months. Classify each variance as favorable or unfavorable. October Actual Cost Standard Cost $ 0 $ $ 0 0 November Actual Cost Standard Cost $ 0 $ 0 $ 0 0
Step by Step Solution
There are 3 Steps involved in it

Get step-by-step solutions from verified subject matter experts