

Question: Please help by explaining how to fill out the chart. When explaining, put everything into chart form like above. Please and thank you. Required information
 Please help by explaining how to fill out the chart. When explaining, put everything into chart form like above. Please and thank you.
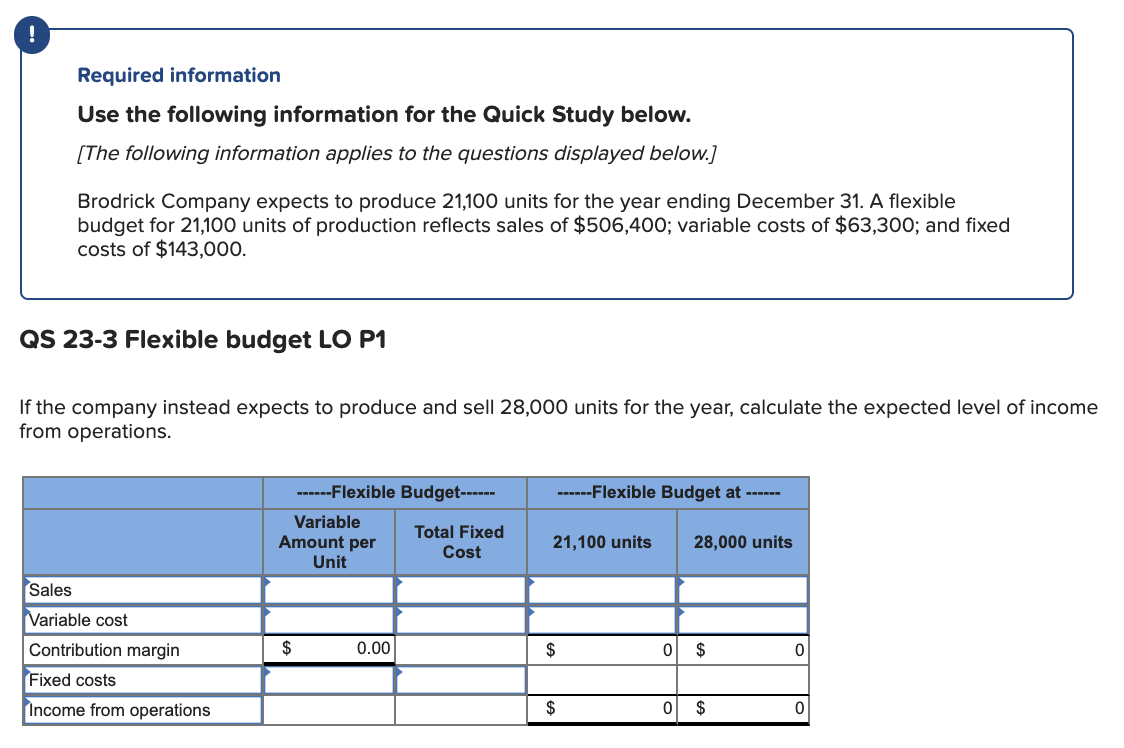
Required information Use the following information for the Quick Study below. [The following information applies to the questions displayed below.) Brodrick Company expects to produce 21,100 units for the year ending December 31. A flexible budget for 21,100 units of production reflects sales of $506,400; variable costs of $63,300; and fixed costs of $143,000. QS 23-3 Flexible budget LO P1 If the company instead expects to produce and sell 28,000 units for the year, calculate the expected level of income from operations. ------Flexible Budget at ------ ------Flexible Budget------ Variable Total Fixed Amount per Cost Unit 21,100 units 28,000 units Sales $ 0.00 $ 0 $ 0 Variable cost Contribution margin Fixed costs Income from operations $ 0 $ 0
Step by Step Solution
There are 3 Steps involved in it

Get step-by-step solutions from verified subject matter experts