

Question: please help Critical Values for Correlation Coefficient n 3 0.997 4 0.950 5 0.878 6 0.811 7 0.754 8 0.707 9 0.666 10 0.632 11
please help
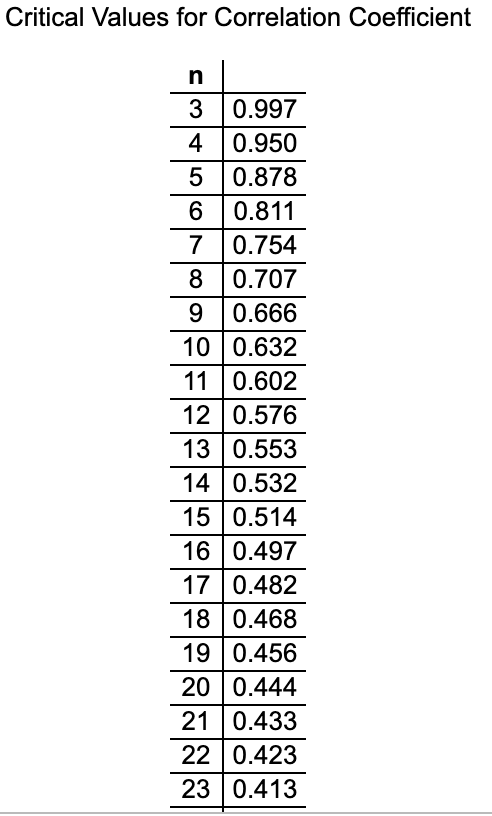
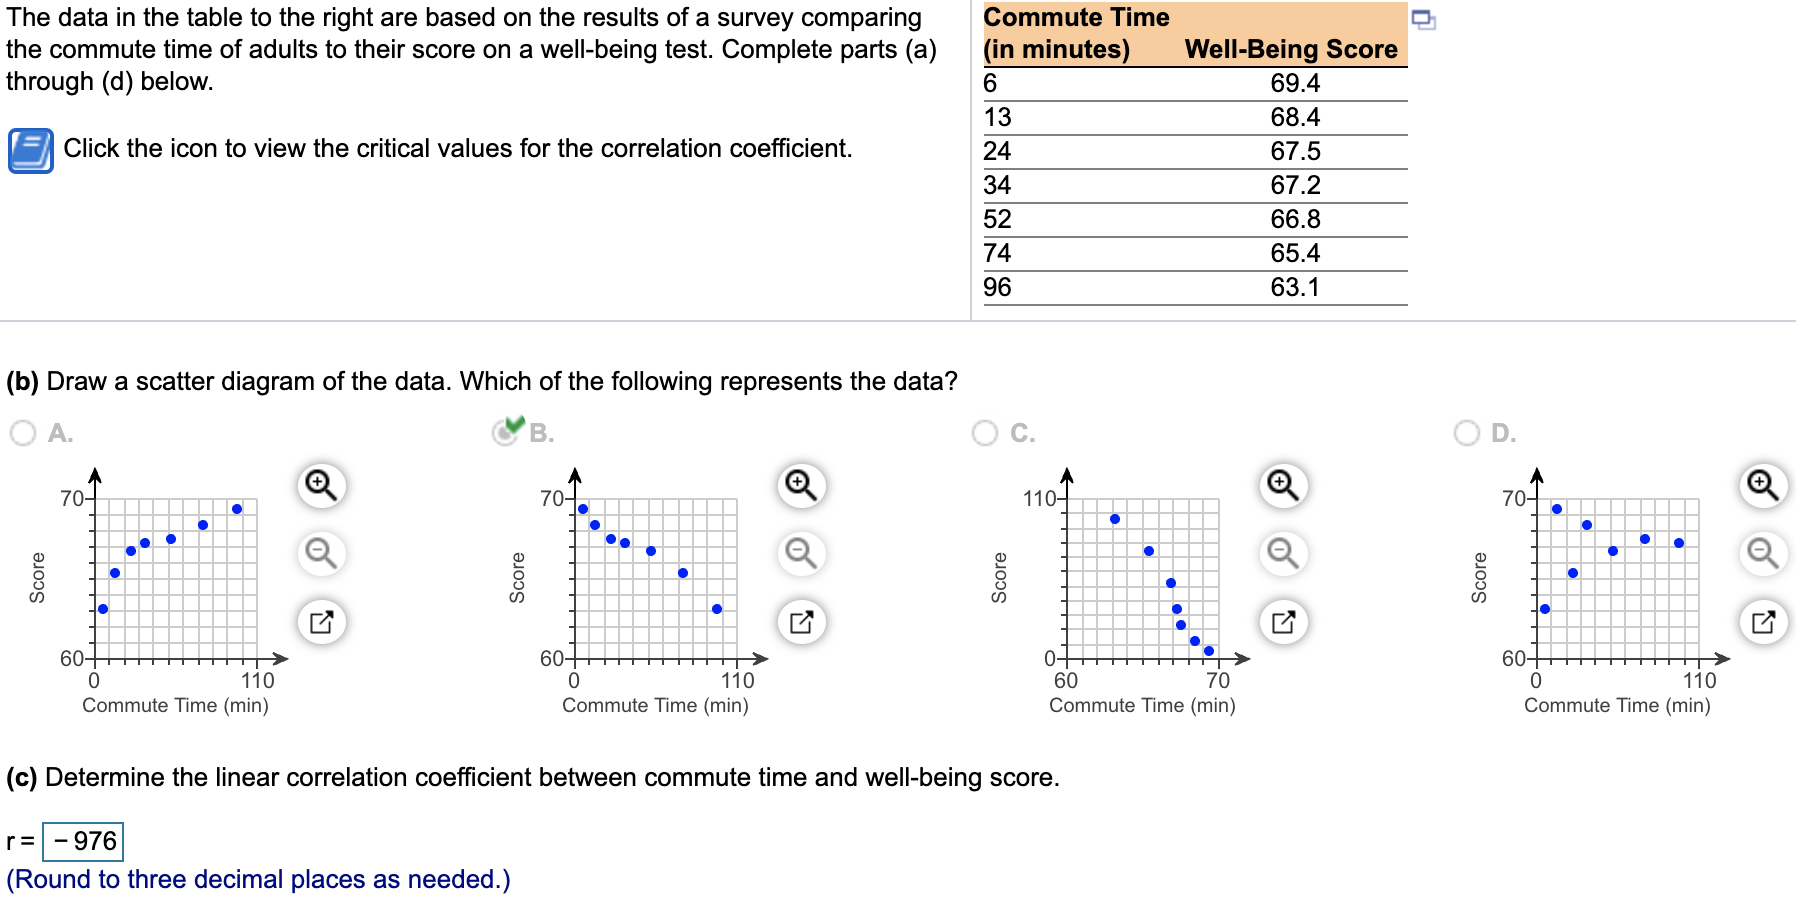
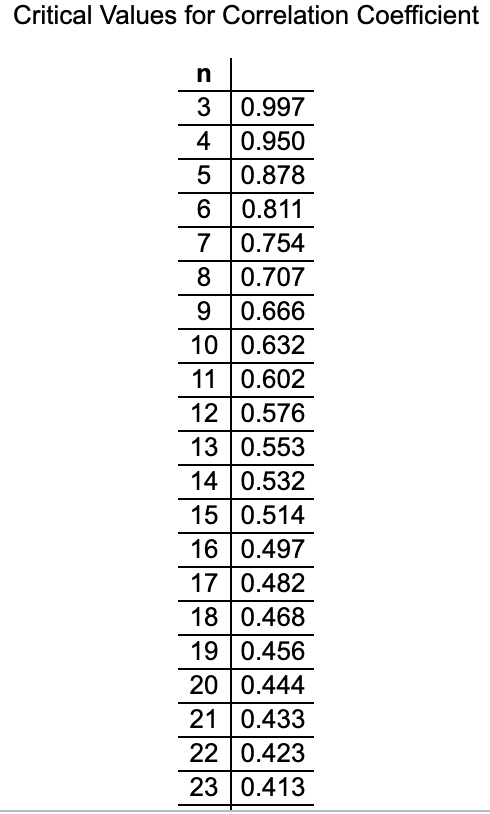
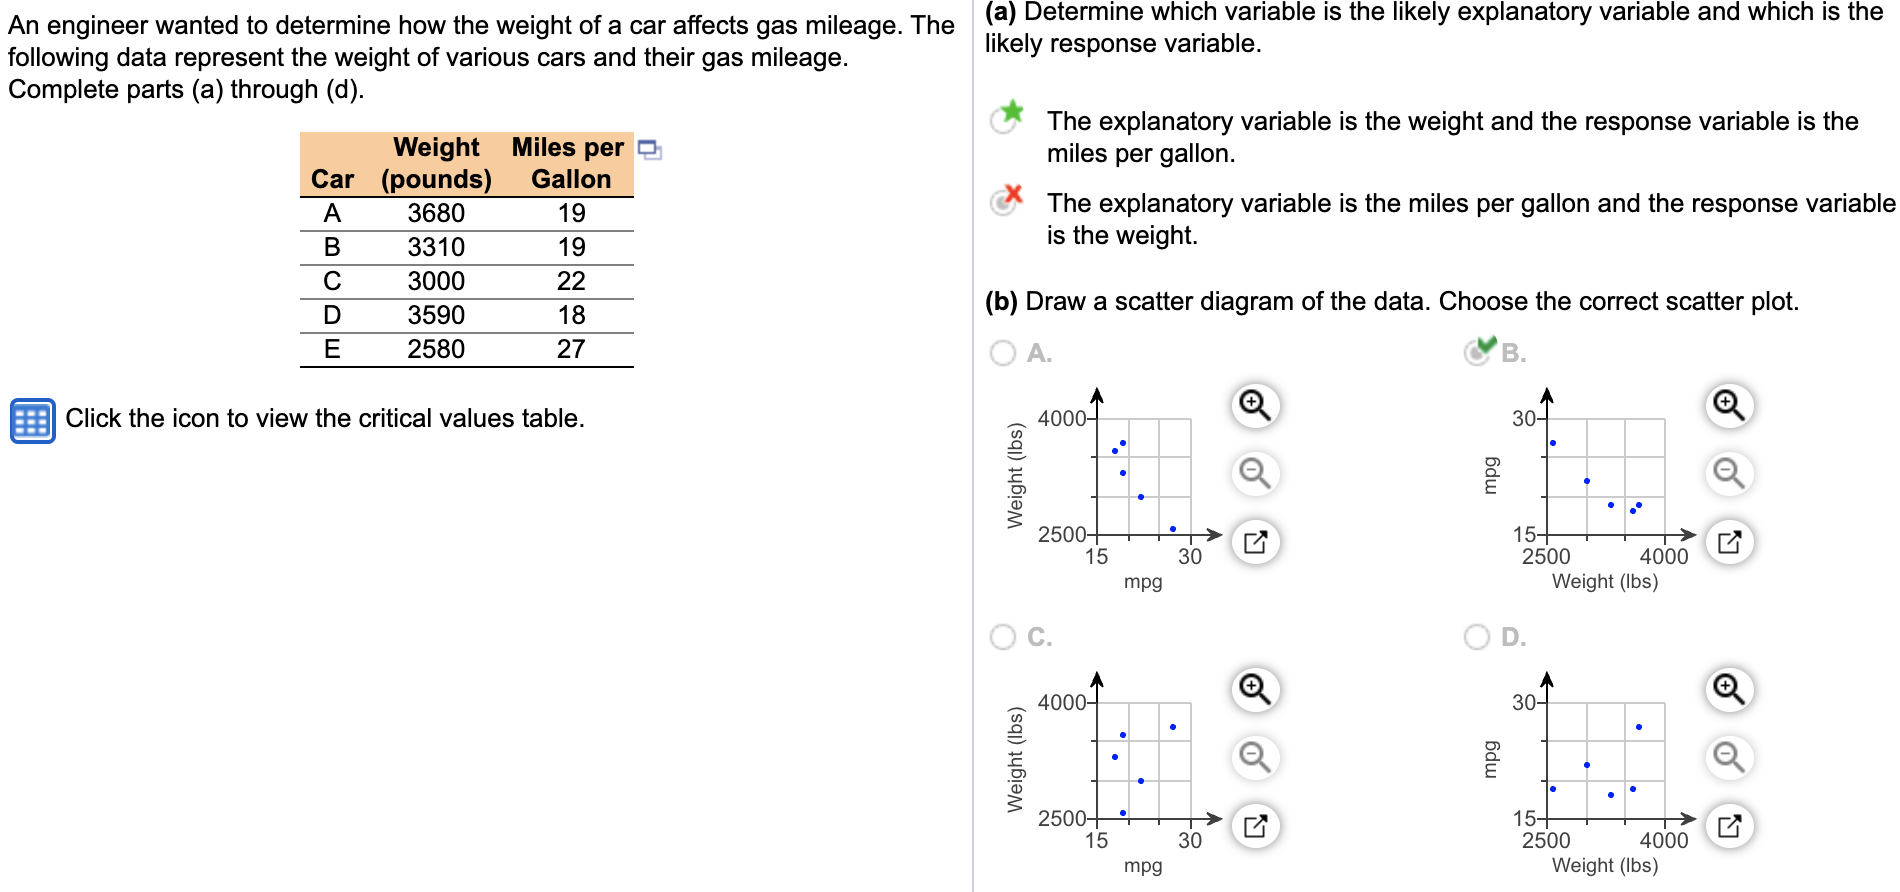
Critical Values for Correlation Coefficient n 3 0.997 4 0.950 5 0.878 6 0.811 7 0.754 8 0.707 9 0.666 10 0.632 11 0.602 12 0.576 13 0.553 14 0.532 15 0.514 16 0.497 17 0.482 18 0.468 19 0.456 20 0.444 21 0.433 22 0.423 23 0.413The data in the table to the right are based on the results of a survey comparing Commute Time the commute time of adults to their score on a well-being test. Complete parts (a) (in minutes) Well-Being Score through (d) below. 6 69.4 13 68.4 Click the icon to view the critical values for the correlation coefficient. 24 67.5 34 67.2 52 66.8 74 65.4 96 63.1 (b) Draw a scatter diagram of the data. Which of the following represents the data? O A. B. O C. O D. 701 70- + 110- 707 Score Score Score Score 60- 60- 60-+ 0 110 110 60 70 0 110 Commute Time (min) Commute Time (min) Commute Time (min) Commute Time (min) (c) Determine the linear correlation coefficient between commute time and well-being score. r= -976 (Round to three decimal places as needed.)Critical Values for Correlation Coefficient n 3 0.997 4 0.950 5 0.878 6 0.811 7 0.754 0.707 9 0.666 10 0.632 11 0.602 12 0.576 13 0.553 14 0.532 15 0.514 16 0.497 17 0.482 18 0.468 19 0.456 20 0.444 21 0.433 22 0.423 23 0.413(a) Determine which variable is the likely explanatory variable and which is the An engineer wanted to determine how the weight of a car affects gas mileage. The . . likely response variable. following data represent the weight of various cars and their gas mileage. Complete parts (a) through (d). * The explanatory variable is the weight and the response variable is the Weight Miles per D. miles per gallon. Car (pounds) Gallon x _ _ _ _ W k The explanatory variable Is the miles per gallon and the response variable W is the weight. C 3000 22 W (b) Draw a scatter diagram of the data. Choose the correct scatter plot. E 2580 27 A. V B. Click the icon to view the critical values table. 30 E E 15 2500 4000 '3 Weight (lbs) C. D Weight (lbs) )' 2500 4000 D Weight (lbs)
Step by Step Solution
There are 3 Steps involved in it

Get step-by-step solutions from verified subject matter experts