Question: Please help deadline in 40 mins. 1 are web sites where companies and suppliers conduct business-to-business activities: 1.0 E-procurements 2.0 E-Marketplaces 3. E-marketspaces 4. O

 Please help deadline in 40 mins.
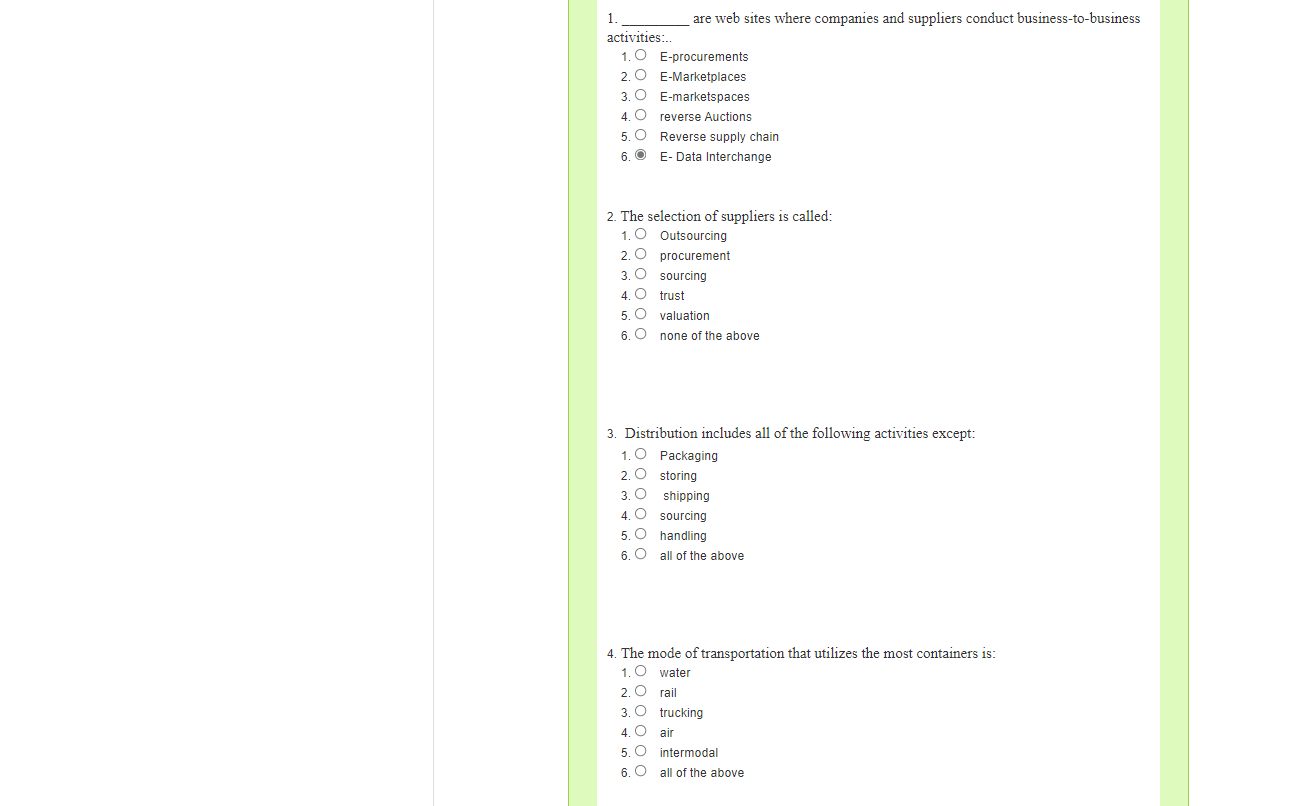
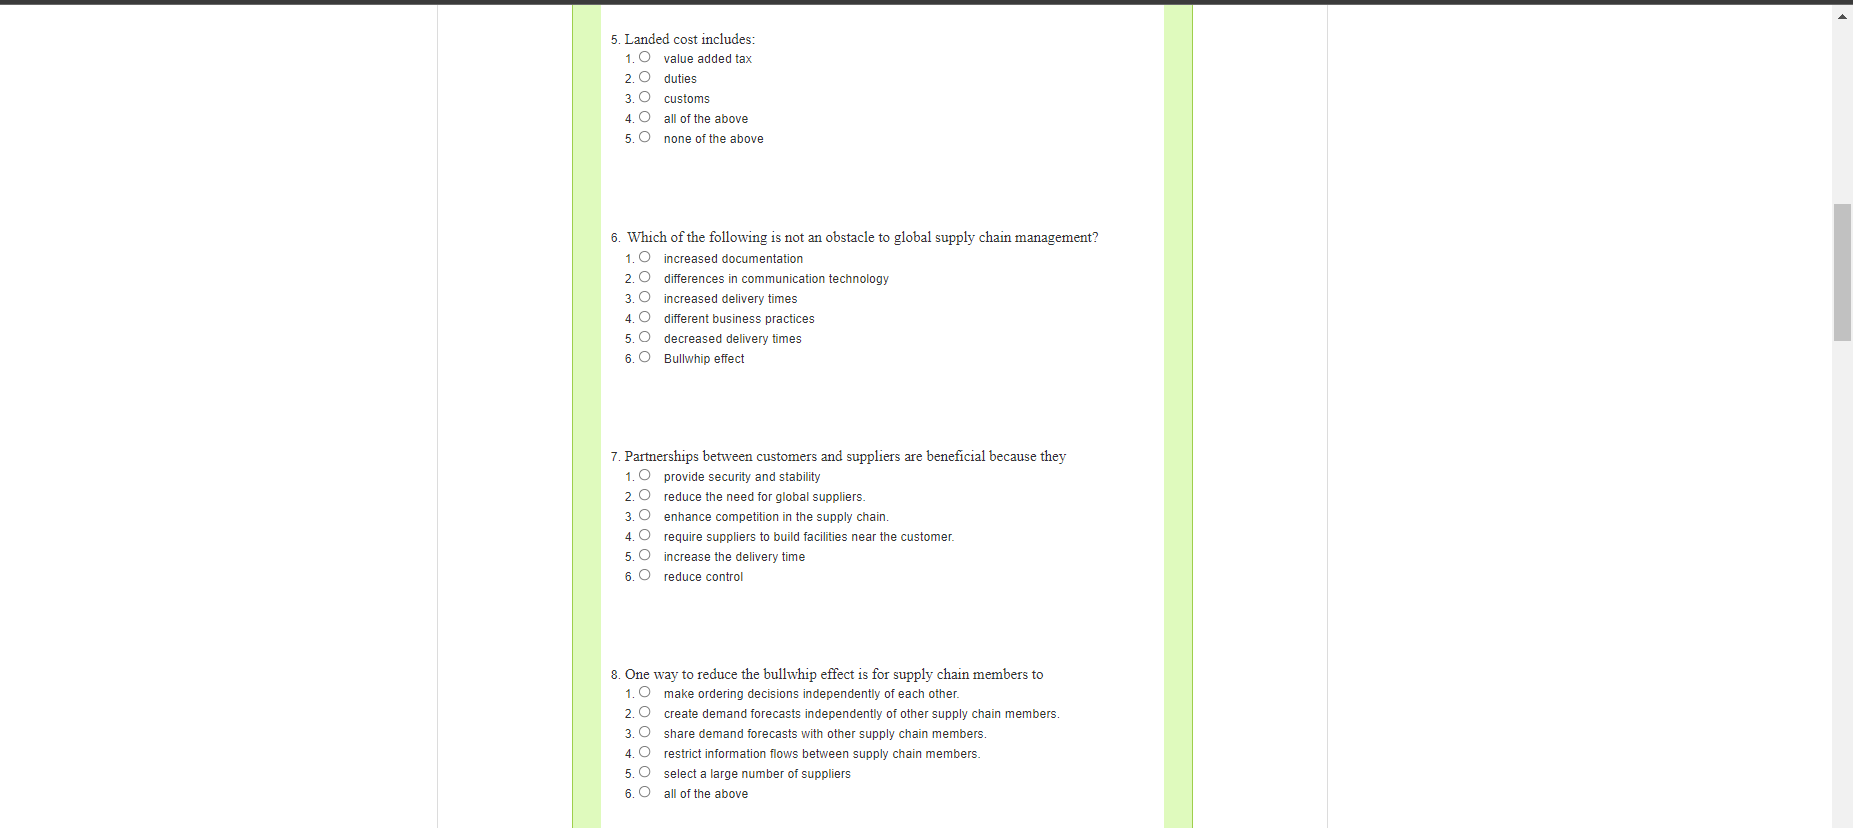
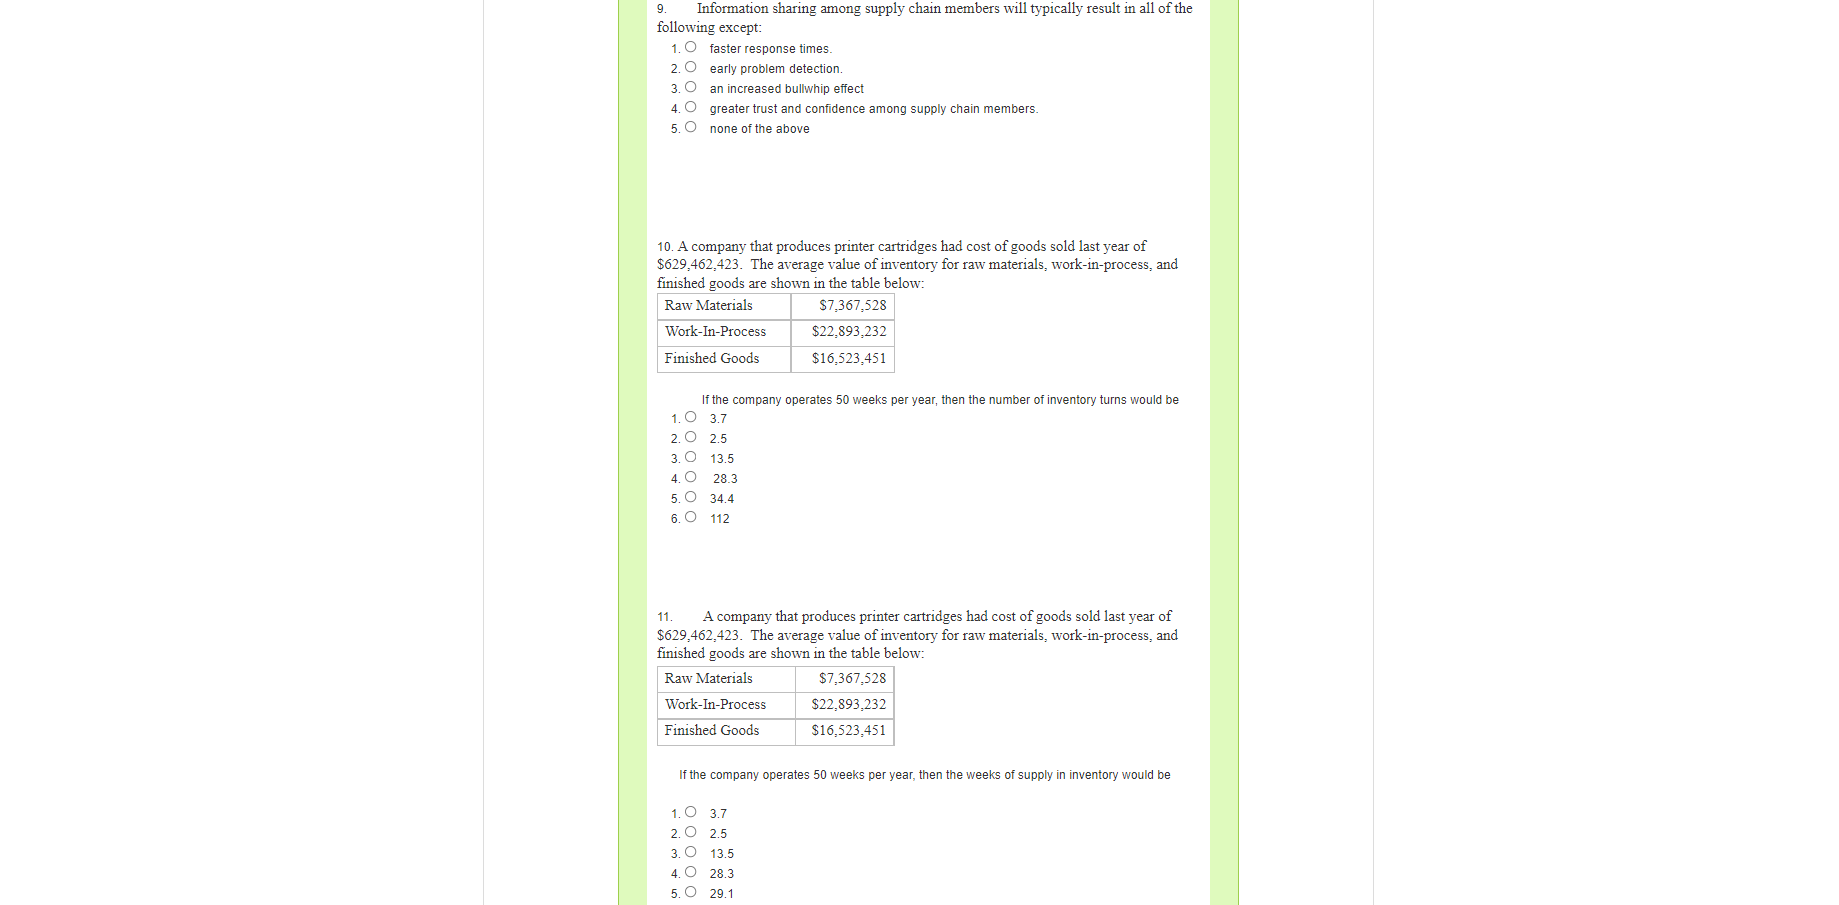
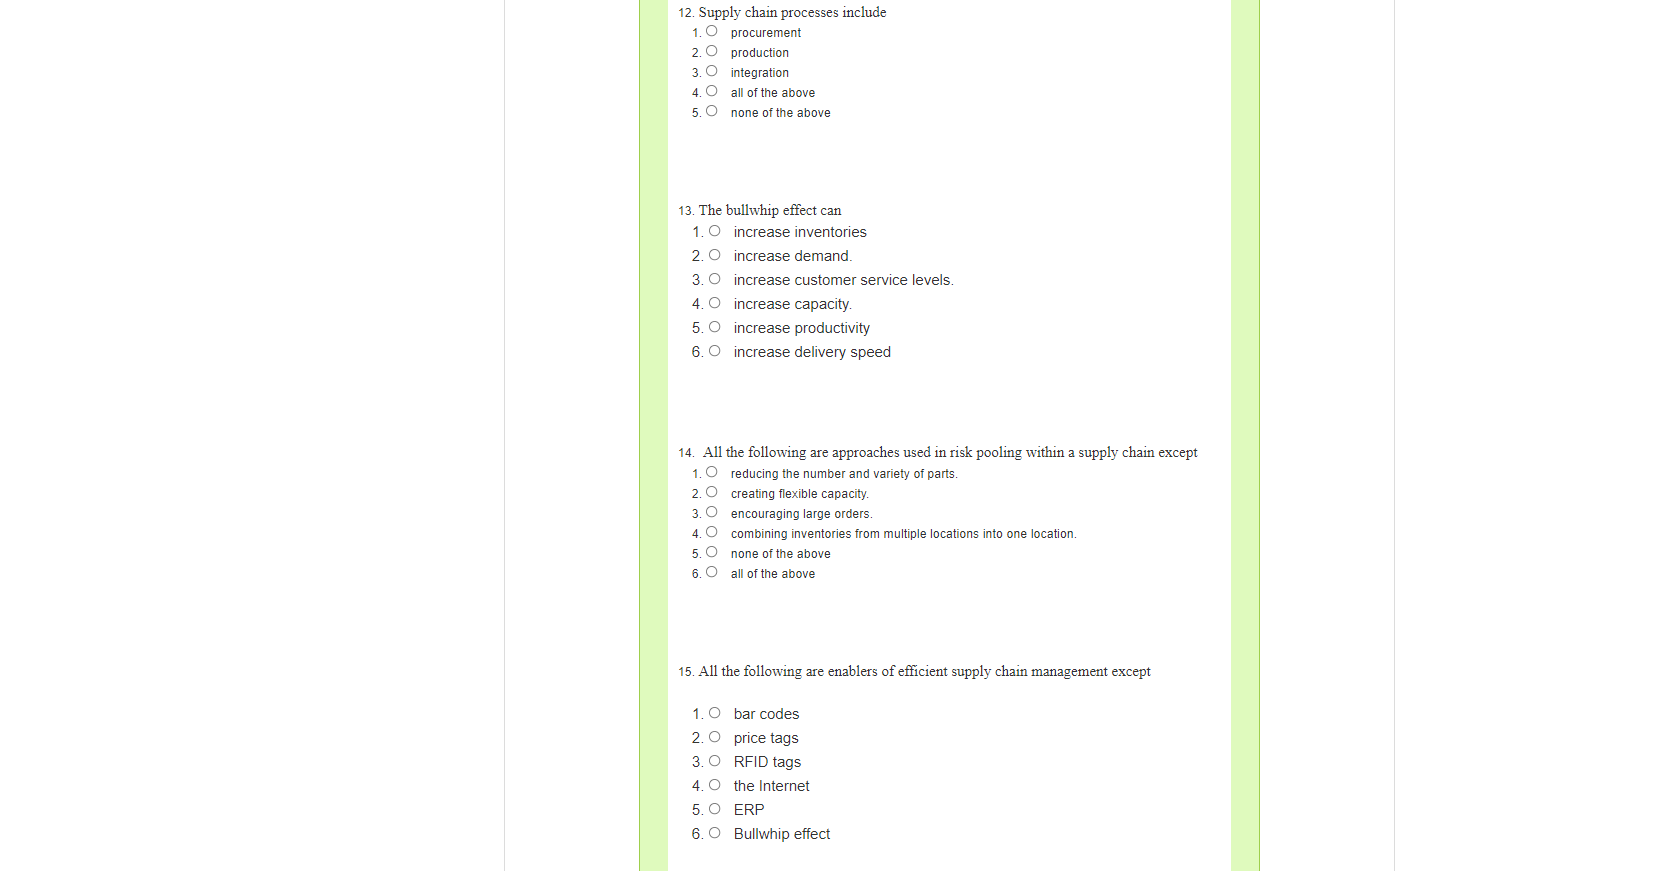
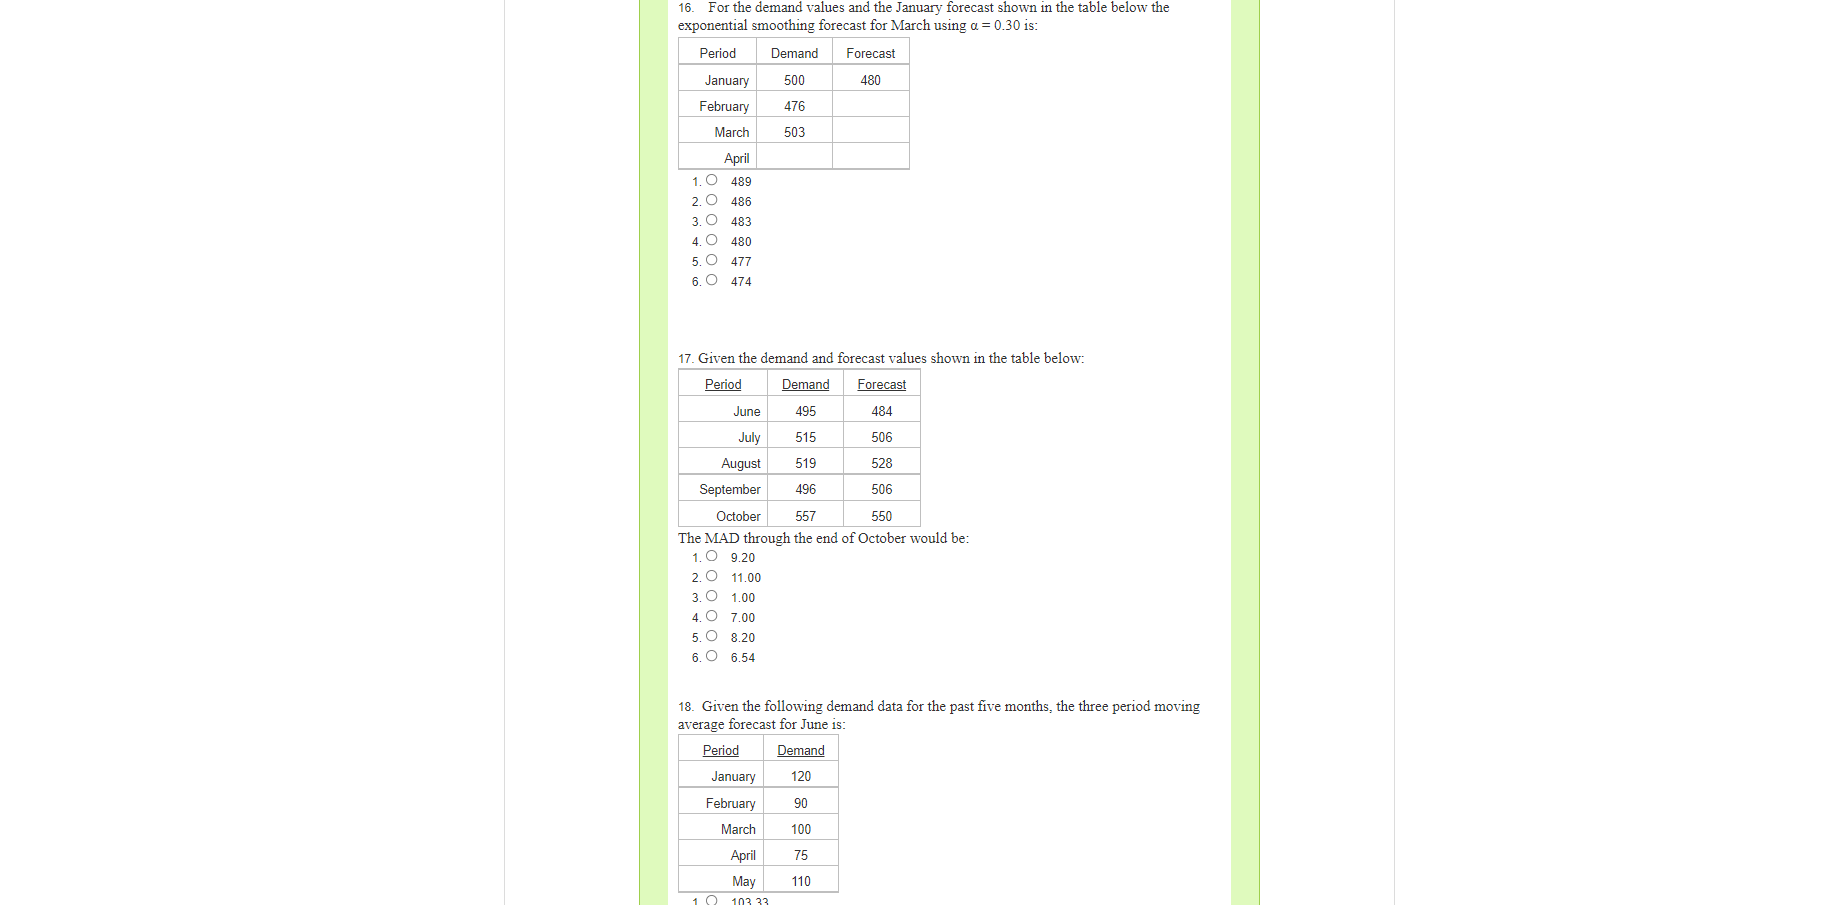
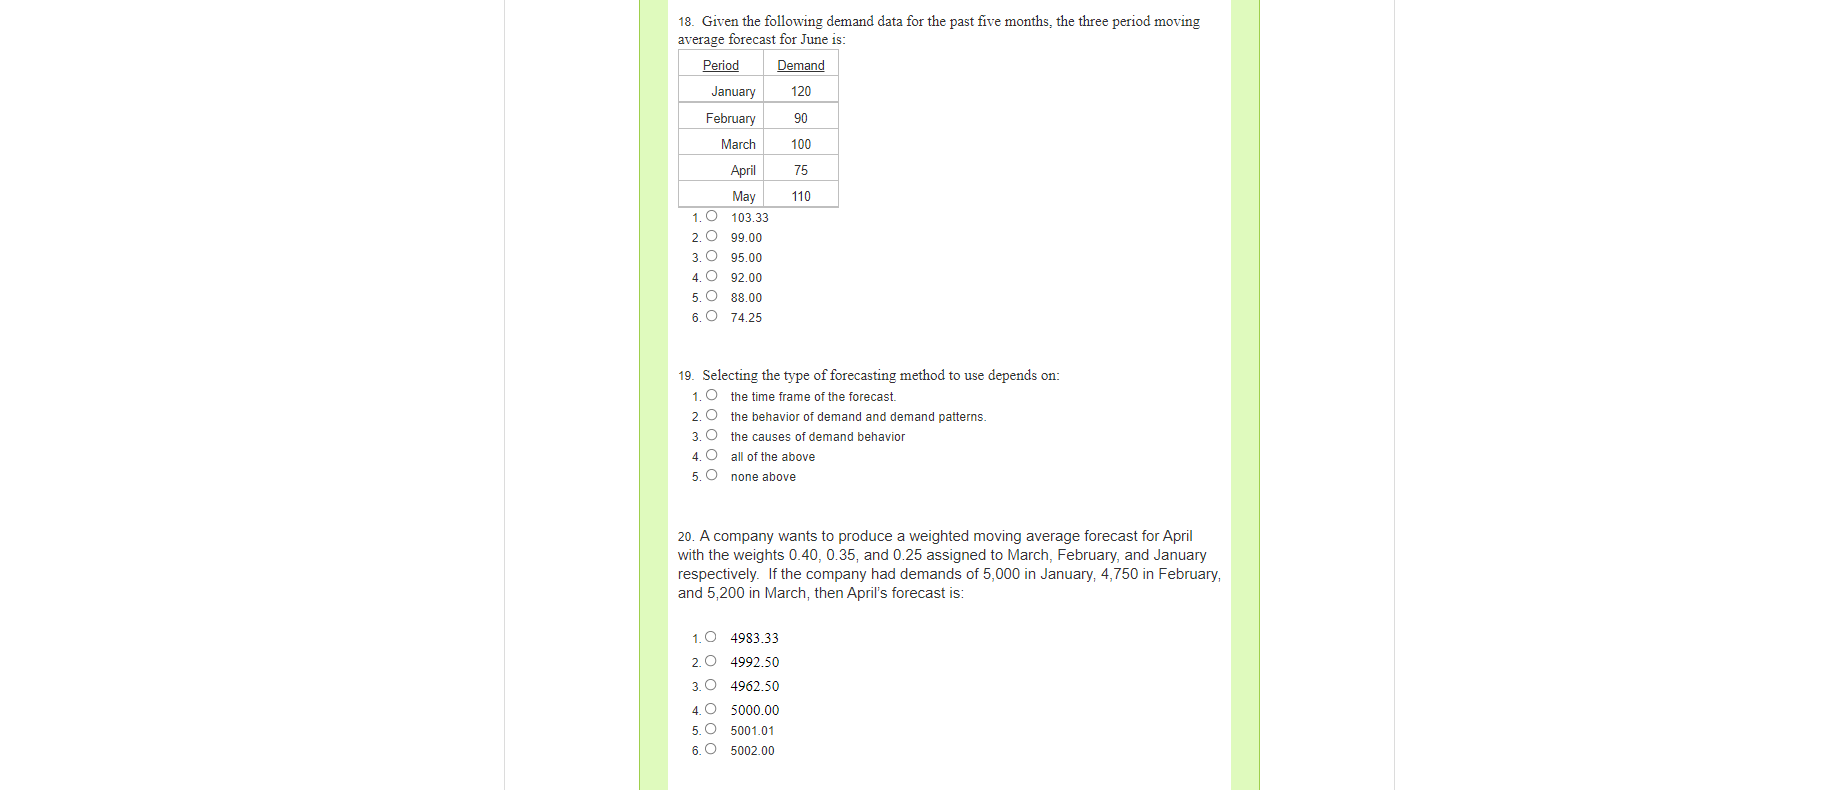
1 are web sites where companies and suppliers conduct business-to-business activities: 1.0 E-procurements 2.0 E-Marketplaces 3. E-marketspaces 4. O reverse Auctions 5. Reverse supply chain 6. E-Data Interchange 2. The selection of suppliers is called: 1.0 Outsourcing 2.0 procurement 3.0 Sourcing 4. O trust 5. O valuation 6. O none of the above 3. Distribution includes all of the following activities except: 1.0 Packaging 2.0 storing 3. shipping 4. O sourcing 5. O handling 6. O all of the above 4. The mode of transportation that utilizes the most containers is: 1.0 water 2.0 rail 3. O trucking 4 0 air 5. O intermodal 6. O all of the above 5. Landed cost includes: 1. O value added tax 2.C duties 3. customs 4. C all of the above 5. O none of the above 6. Which of the following is not an obstacle to global supply chain management? 1.0 increased documentation 2. a differences in communication technology 3. O increased delivery times 4.C different business practices 5. decreased delivery times 6. O Bullwhip effect 7. Partnerships between customers and suppliers are beneficial because they 1. O provide security and stability 2. O reduce the need for global suppliers. 3. O enhance competition in the supply chain. 4. require suppliers to build facilities near the customer. 5. O increase the delivery time 6. O reduce control 8. One way to reduce the bullwhip effect is for supply chain members to 1. O make ordering decisions independently of each other. 2.0 create demand forecasts independently of other supply chain members. 3.0 share demand forecasts with other supply chain members. 4. O restrict information flows between supply chain members. 5. O select a large number of suppliers 6. O all of the above 9. Information sharing among supply chain members will typically result in all of the following except: 1. O faster response times. 2. O early problem detection, 3. O an increased bullwhip effect 4.O greater trust and confidence among supply chain members. 5.0 none of the above 10. A company that produces printer cartridges had cost of goods sold last year of $629,462,423. The average value of inventory for raw materials, work-in-process, and finished goods are shown in the table below: Raw Materials $7,367,528 Work-In-Process $22.893,232 Finished Goods $16,523,451 If the company operates 50 weeks per year, then the number of inventory turns would be 1.0 3.7 2.0 2.5 3. O 13.5 4.0 28.3 5. O 34.4 6. O 112 11 A company that produces printer cartridges had cost of goods sold last year of $629,462,423. The average value of inventory for raw materials, work-in-process, and finished goods are shown in the table below: Raw Materials $7,367,528 Work-In-Process $22,893.232 Finished Goods $16,523,451 If the company operates 50 weeks per year, then the weeks of supply in inventory would be 1.0 3.7 2.0 2.5 3.0 13.5 4.0 28.3 5.0 29.1 12. Supply chain processes include 1. O procurement 2. O production 3.0 integration 4. O all of the above 5. none of the above 13. The bullwhip effect can 1. O increase inventories 2. O increase demand. 3. O increase customer service levels 4. O increase capacity. 5. O increase productivity 6. O increase delivery speed 14. All the following are approaches used in risk pooling within a supply chain except 1. O reducing the number and variety of parts. 2. O creating flexible capacity. 3. O encouraging large orders. 4. O combining inventories from multiple locations into one location. 5. O none of the above 6. O all of the above 15. All the following are enablers of efficient supply chain management except 1. O bar codes 2.0 price tags 3.0 RFID tags 4. O the Internet 5. O ERP 6.0 Bullwhip effect 16. For the demand values and the January forecast shown in the table below the exponential smoothing forecast for March using a = 0.30 is: Period Demand Forecast 500 480 January February 476 March 503 April 1. O 489 2.0 486 3.0 483 40 480 5. a 477 6.0 474 17. Given the demand and forecast values shown in the table below: Period Demand Forecast June 495 484 July 515 506 August 519 528 September 496 506 October 557 550 The MAD through the end of October would be: 1.09.20 2.0 11.00 3. O 1.00 4.0 7.00 5. O 8.20 6.0 6.54 18. Given the following demand data for the past five months, the three period moving average forecast for June is: Period Demand January 120 February 90 March 100 April 75 110 May 10 103 33 16. For the demand values and the January forecast shown in the table below the exponential smoothing forecast for March using a = 0.30 is: Period Demand Forecast 500 480 January February 476 March 503 April 1. O 489 2.0 486 3.0 483 40 480 5. a 477 6.0 474 17. Given the demand and forecast values shown in the table below: Period Demand Forecast June 495 484 July 515 506 August 519 528 September 496 506 October 557 550 The MAD through the end of October would be: 1.09.20 2.0 11.00 3. O 1.00 4.0 7.00 5. O 8.20 6.0 6.54 18. Given the following demand data for the past five months, the three period moving average forecast for June is: Period Demand January 120 February 90 March 100 April 75 110 May 10 103 33 18. Given the following demand data for the past five months, the three period moving average forecast for June is: Period Demand January 120 90 February March April 100 75 110 May 1. O 103.33 2.0 99.00 3. O 95.00 4. 92.00 5.0 88.00 6.0 74.25 19. Selecting the type of forecasting method to use depends on: 1. O the time frame of the forecast. 2. O the behavior of demand and demand patterns 3. O the causes of demand behavior 4. O all of the above 5. O none above 20. A company wants to produce a weighted moving average forecast for April with the weights 0.40, 0.35, and 0.25 assigned to March, February, and January respectively. If the company had demands of 5,000 in January, 4,750 in February, and 5,200 in March, then April's forecast is: 1.0 4983.33 2.0 4992.50 3. O 4962.50 4 0 5000.00 5.0 5001.01 6.0 5002.00


