

Question: please help Debt analysis Springfield Bank is evaluating Creek Enterprises, which has requested a $4,180,000 loan, to assess the firm's financial leverage and financial risk.
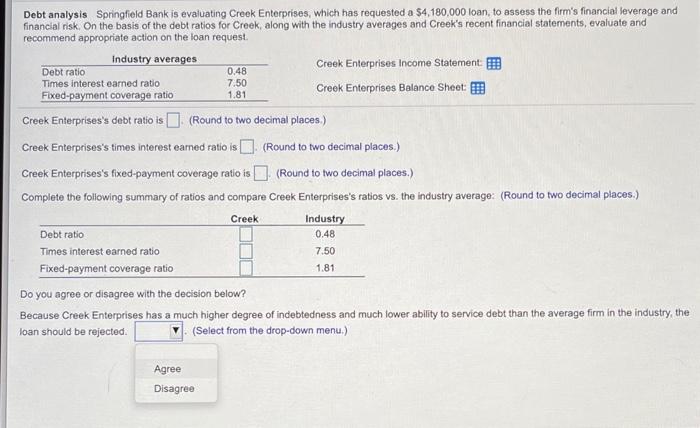
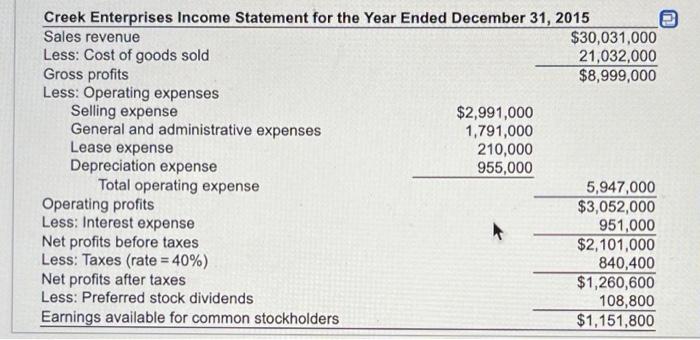
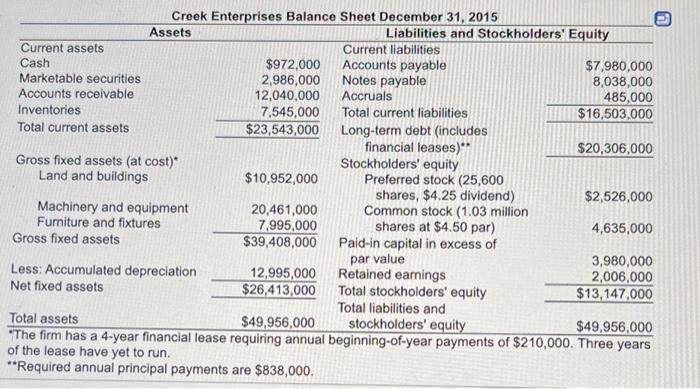
Debt analysis Springfield Bank is evaluating Creek Enterprises, which has requested a $4,180,000 loan, to assess the firm's financial leverage and financial risk. On the basis of the debt ratios for Creek, along with the industry averages and Creek's recent financial statements, evaluate and recommend appropriate action on the loan request Industry averages Debt ratio Creek Enterprises Income Statement Creek Enterprises Balance Sheet: Fixed-payment coverage ratio 1.81 0.48 7.50 Times interest earned ratio Creek Enterprises's debt ratio is (Round to two decimal places.) Creek Enterprises's times interest earned ratio is (Round to two decimal places.) Creek Enterprises's fixed-payment coverage ratio is (Round to two decimal places.) Complete the following summary of ratios and compare Creek Enterprises's ratios vs. the industry average: (Round to two decimal places.) Creek Industry 0.48 Debt ratio Times interest earned ratio 7.50 Fixed-payment coverage ratio 1.81 Do you agree or disagree with the decision below? Because Creek Enterprises has a much higher degree of indebtedness and much lower ability to service debt than the average firm in the industry, the (Select from the drop-down menu.) loan should be rejected. Agree Disagree Creek Enterprises Income Statement for the Year Ended December 31, 2015 Sales revenue $30,031,000 Less: Cost of goods sold 21,032,000 Gross profits $8,999,000 Less: Operating expenses Selling expense $2,991,000 General and administrative expenses 1,791,000 Lease expense 210,000 Depreciation expense 955,000 Total operating expense 5,947,000 Operating profits $3,052,000 Less: Interest expense 951,000 Net profits before taxes $2,101,000 Less: Taxes (rate = 40%) 840,400 Net profits after taxes $1,260,600 Less: Preferred stock dividends 108,800 Earnings available for common stockholders $1,151,800 Creek Enterprises Balance Sheet December 31, 2015 Assets Liabilities and Stockholders' Equity Current assets Current liabilities Cash $972,000 Accounts payable $7,980,000 Marketable securities 2,986,000 Notes payable 8,038,000 Accounts receivable 12,040,000 Accruals 485,000 Inventories 7,545,000 Total current liabilities $16,503,000 Total current assets $23,543,000 Long-term debt (includes financial leases) $20,306,000 Gross fixed assets (at cost)* Stockholders' equity Land and buildings $10,952,000 Preferred stock (25,600 shares, $4.25 dividend) $2,526,000 Machinery and equipment 20,461,000 Common stock (1.03 million Furniture and fixtures 7.995,000 shares at $4.50 par) 4,635,000 Gross fixed assets $39,408,000 Paid-in capital in excess of par value 3,980,000 Less: Accumulated depreciation 12,995,000 Retained earnings 2,006,000 Net fixed assets $26,413,000 Total stockholders' equity $13,147,000 Total liabilities and Total assets $49,956,000 stockholders' equity $49,956,000 *The firm has a 4-year financial lease requiring annual beginning-of-year payments of $210,000. Three years of the lease have yet to run. **Required annual principal payments are $838,000
Step by Step Solution
There are 3 Steps involved in it

Get step-by-step solutions from verified subject matter experts