

Question: pLEASE HELP!!! Decisions / Reports Menu WORKFORCE COMPENSATION & TRAINING North America Europe-Africa Asia-Pacific Latin America Facility Facility Facility Facility DECISION ENTRIES - YEAR 11
pLEASE HELP!!!
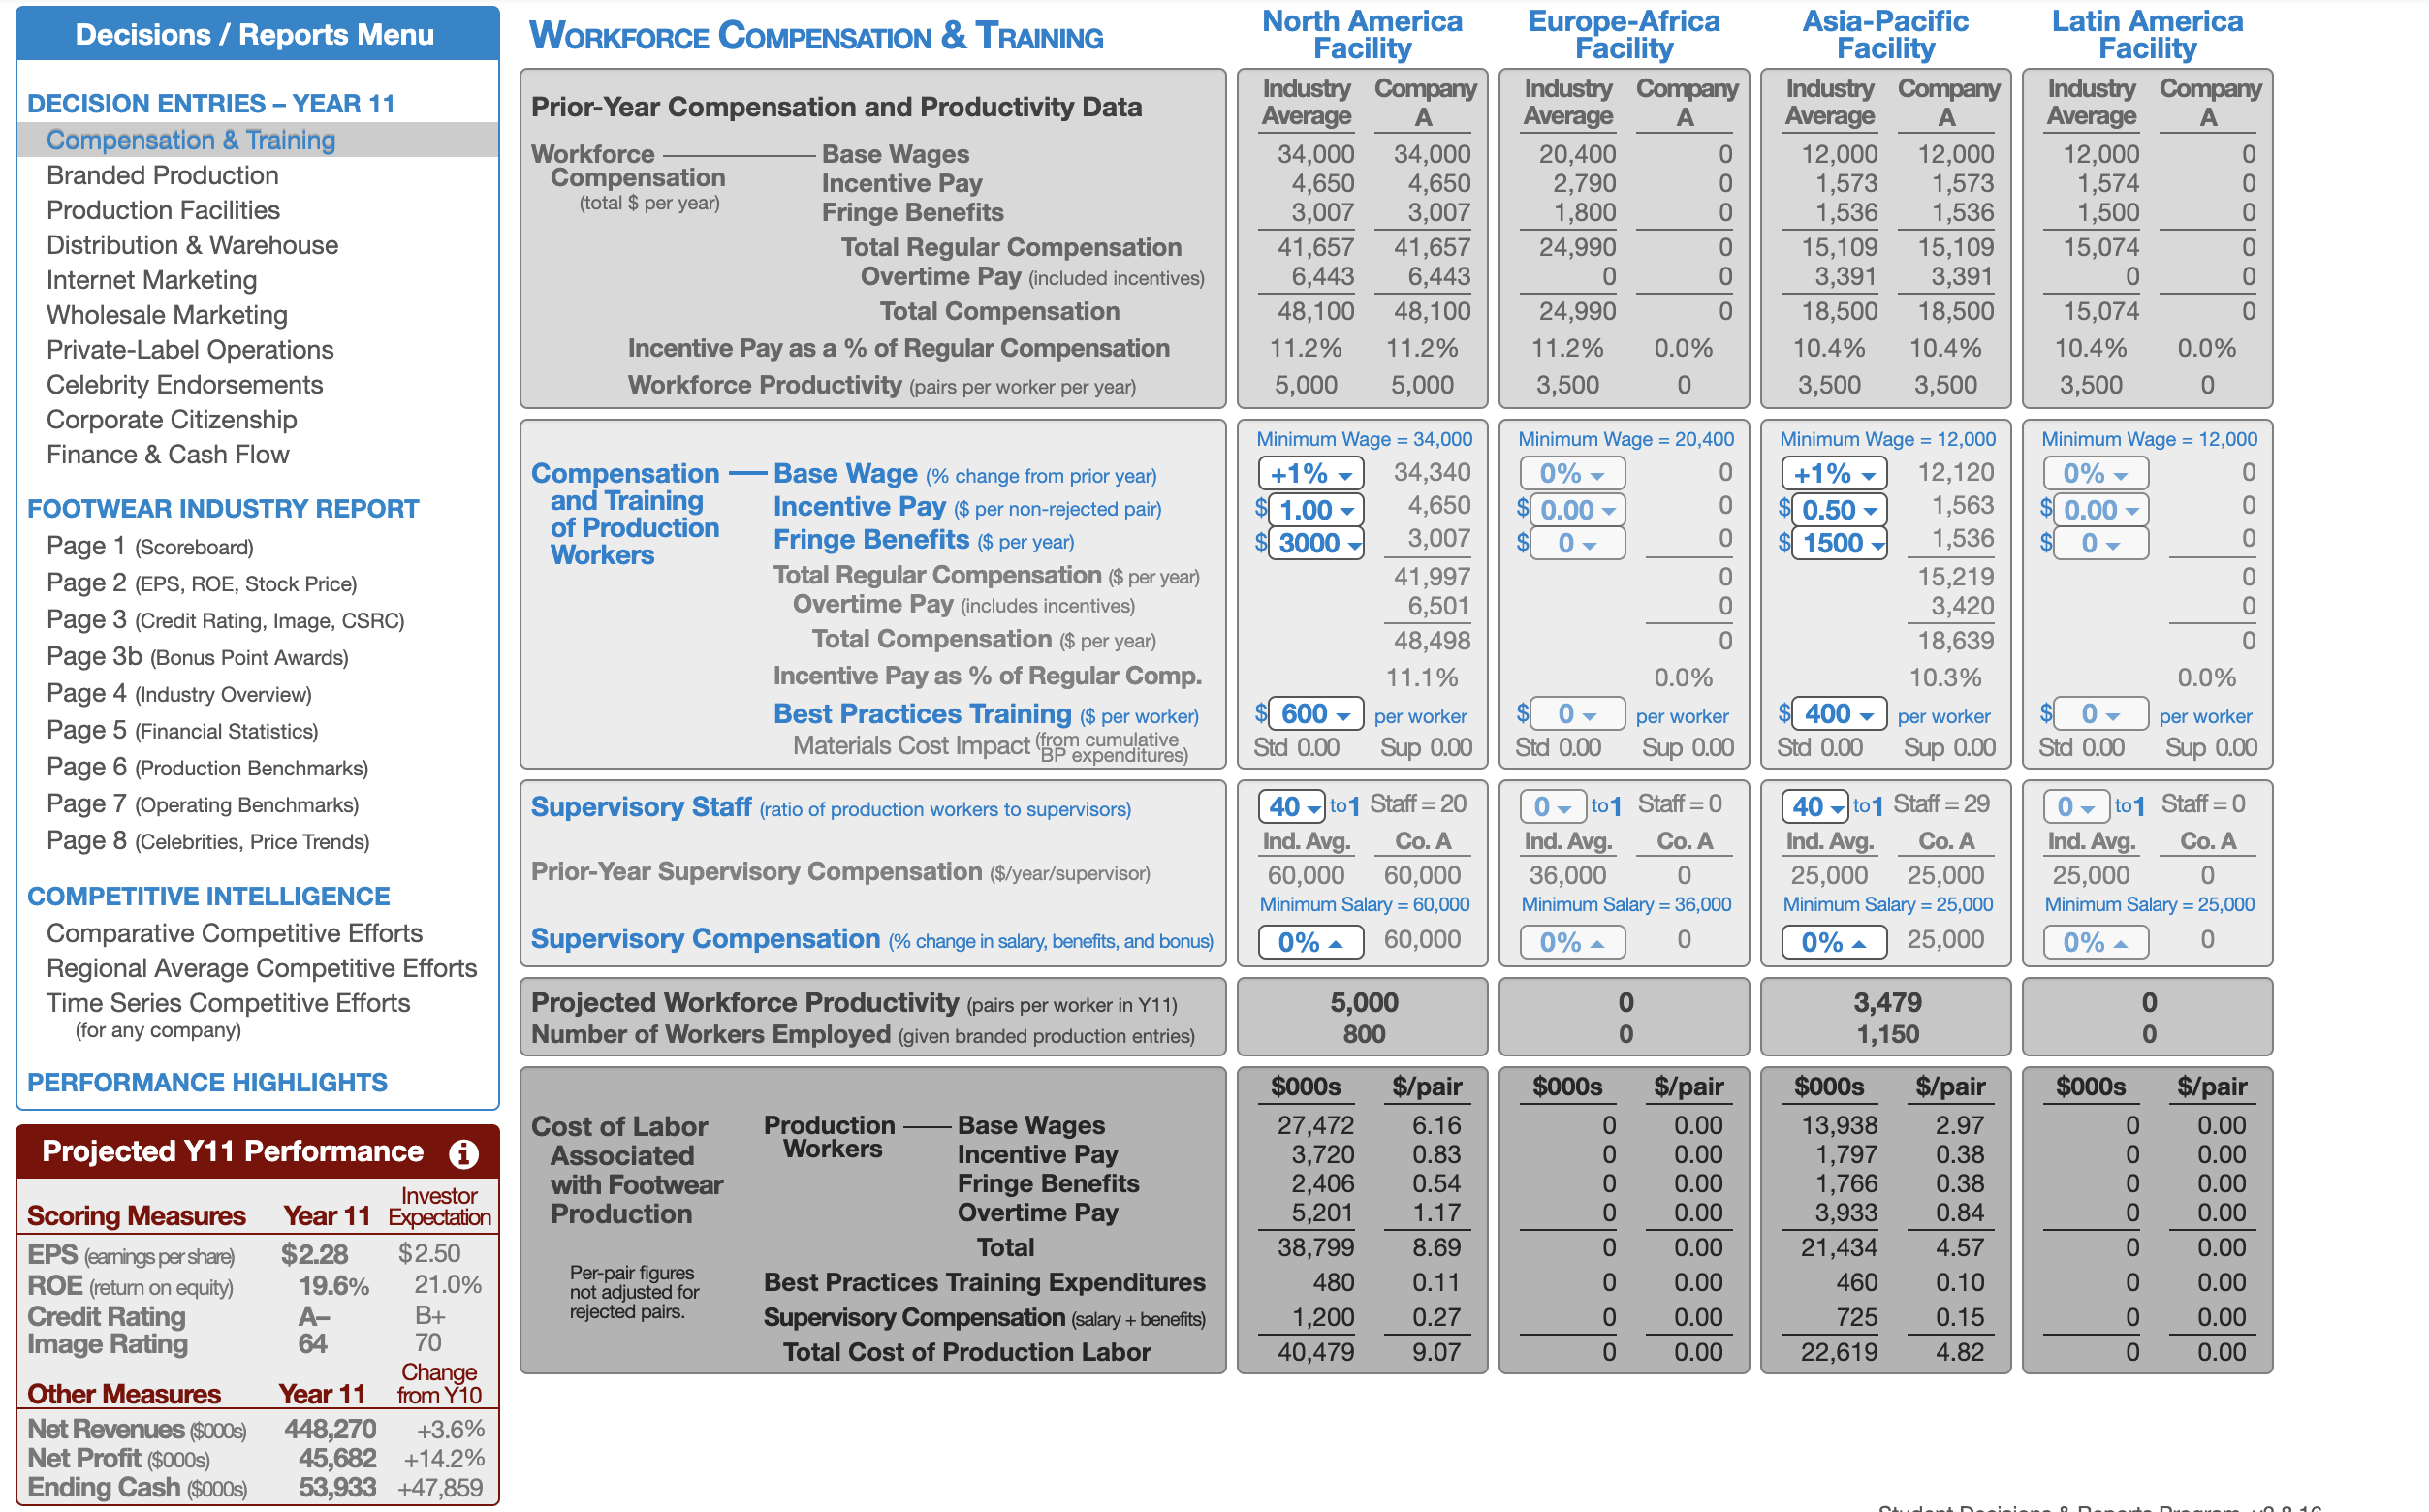
Decisions / Reports Menu WORKFORCE COMPENSATION & TRAINING North America Europe-Africa Asia-Pacific Latin America Facility Facility Facility Facility DECISION ENTRIES - YEAR 11 Prior-Year Compensation and Productivity Data Industry Company Industry Company Industry Company Industry Company Average Average Average Average A Compensation & Training Base Wages 34,000 34,000 20,400 12,000 12,000 12,000 Branded Production Workforce Compensation (total $ per year) Incentive Pay 4,650 2,790 1,573 1,573 1,574 Production Facilities Fringe Benefits 3,007 3,007 1.800 1,536 1,536 1,500 Distribution & Warehouse Total Regular Compensation 41,657 41,657 24,990 15, 109 15, 109 15,074 lood Internet Marketing Overtime Pay (included incentives) 6,443 6,443 3,391 3,391 Wholesale Marketing Total Compensation 48, 100 48, 100 24,990 ol 18,500 18,500 15,074 olo Private-Label Operations Incentive Pay as a % of Regular Compensation 11.2% 11.2% 11.2% 0.0% 10.4% 10.4% 10.4% Celebrity Endorsements Workforce Productivity (pairs per worker per year) 5,000 5,000 3,500 0 3,500 3,500 3,500 Corporate Citizenship Minimum Wage = 34,000 Minimum Wage = 20,400 Minimum Wage = 12,000 Minimum Wage = 12,000 Finance & Cash Flow Compensation Base Wage (% change from prior year) +1% 0% +1% 12,120 0% 0 FOOTWEAR INDUSTRY REPORT and Training $ 0.50 1,563 $ 0.00 O of Production Incentive Pay ($ per non-rejected pair) $ 1.00 4,650 $ 0.00 Fringe Benefits ($ per year) $ 3000 3,007 $ 1500 1,536 $ 0 - 0 Page 1 (Scoreboard) Workers Page 2 (EPS, ROE, Stock Price) Total Regular Compensation ($ per year) 41,997 15,219 Page 3 (Credit Rating, Image, CSRC) Overtime Pay (includes incentives) 6,501 3,420 48,498 18,639 Page 3b (Bonus Point Awards) Total Compensation ($ per year) olool Page 4 (Industry Overview) Incentive Pay as % of Regular Comp. 11.1% 0.0% 10.3% Best Practices Training ($ per worker) $ 600 - per worker $ 0 per worker $ 400 - per worker $ 0 - per worker Page 5 (Financial Statistics) Page 6 (Production Benchmarks) Materials Cost Impact grom cumulative 'BP expenditures) Std 0.00 Sup 0.00 Std 0.00 Sup 0.00 Std 0.00 Sup 0.00 Std 0.00 Sup 0.00 Page 7 (Operating Benchmarks) Supervisory Staff (ratio of production workers to supervisors) 40 - to1 Staff = 20 0 - to1 Staff = 0 40 - to1 Staff = 29 0 v to1 Staff = 0 Page 8 (Celebrities, Price Trends) Ind. Avg. Co. A Ind. Avg. Co. A Ind. Avg. Co. A Ind. Avg. Co. A Prior-Year Supervisory Compensation ($/year/supervisor) 60,000 60,000 36,000 0 25,000 25,000 25,000 COMPETITIVE INTELLIGENCE Minimum Salary = 60,000 Minimum Salary = 36,000 Minimum Salary = 25,000 Minimum Salary = 25,000 Comparative Competitive Efforts Supervisory Compensation (% change in salary, benefits, and bonus) 60,000 0% 0% 25,000 Regional Average Competitive Efforts Time Series Competitive Efforts Projected Workforce Productivity (pairs per worker in Y11) 5,000 3,479 (for any company) Number of Workers Employed (given branded production entries) 800 1,150 PERFORMANCE HIGHLIGHTS $000s $/pair $000s $/pair $000s $/pair $000s $/pair Cost of Labor Production Base Wages 27,472 6.16 0.00 13,938 2.97 Projected Y11 Performance Associated Workers Incentive Pay 3,720 0.83 1,797 0.38 0.00 Investor with Footwear Fringe Benefits 2,406 0.00 1,766 0.38 0.00 Scoring Measures Year 11 Expectation Production Overtime Pay 5.201 1.17 0.00 3,933 4.57 0.00 EPS (earnings per share) $2.28 $ 2.50 Total 38,799 3.69 0.00 21,434 oloooo ROE (return on equity) 19.6% 21.0% Per-pair figures Best Practices Training Expenditures 0.11 0.00 0.00 not adjusted for 480 460 0.10 Credit Rating A- B+ rejected pairs. Supervisory Compensation (salary + benefits) 1,200 725 0.15 Image Rating 64 lo ooloooo 0.00 lo 0.00 70 Total Cost of Production Labor 40,479 9.07 0 22,619 Other Measures Change Year 11 from Y10 Net Revenues ($000s) 448,270 Net Profit ($000s) 45,682 +14.2% Ending Cash ($000s) 53,933 +47,859
Step by Step Solution
There are 3 Steps involved in it

Get step-by-step solutions from verified subject matter experts